Workshop
- Identity provider
- WARP and device posture
- Cloudflare Tunnel
- Access and Private Network
- Browser isolation and App launcher
- Digital experience monitoring
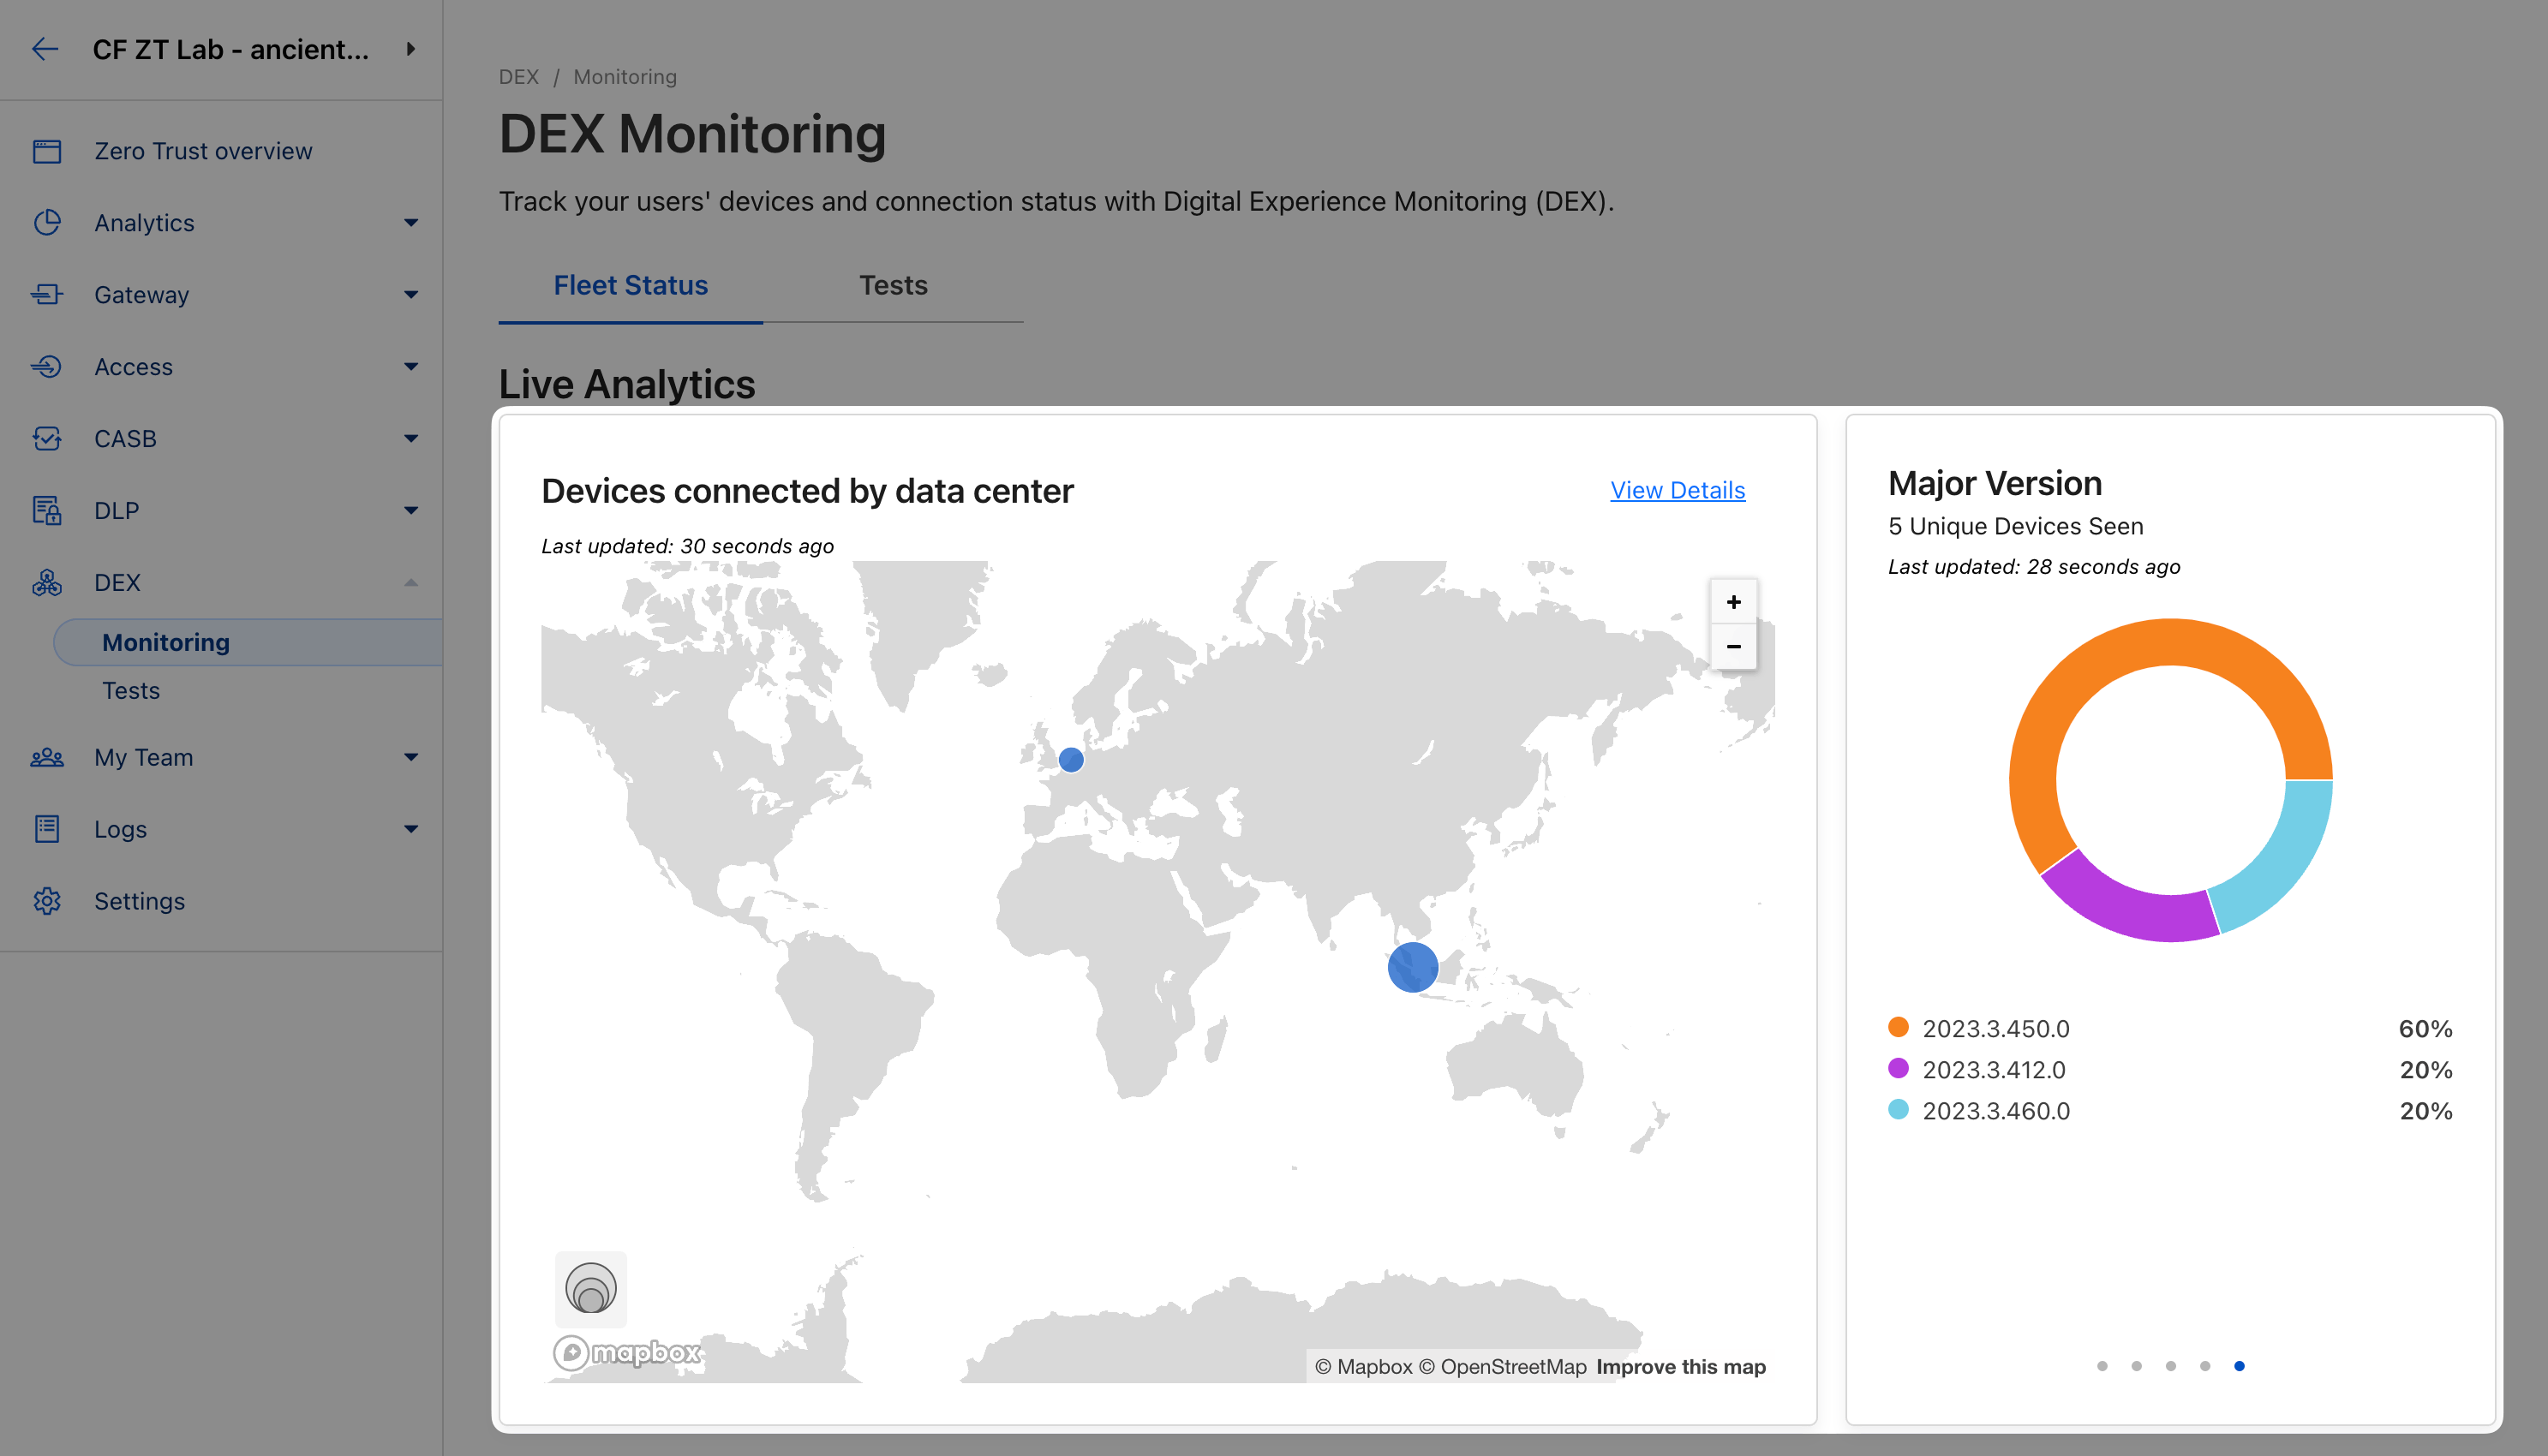
Gain visibility into the experience of your WARP clients.
Navigate to DEX ‣ Monitoring in your Zero Trust dashboard and explore the available data about your fleet. Notice how clicking on each geographical point reveals more details about devices in that location.
To better understand your clients’ connectivity to key services, you can create a synthetic test that will be executed by every WARP client in your fleet, at a specified interval.
Navigate to DEX ‣ Tests and Add a Test.
Let’s create a test that monitors access to Cloudflare’s status page:
⚙️ nocopy ⚙️
Target: https://www.cloudflarestatus.com/
Test_type: HTTP Get
Test_frequency: 5 minutes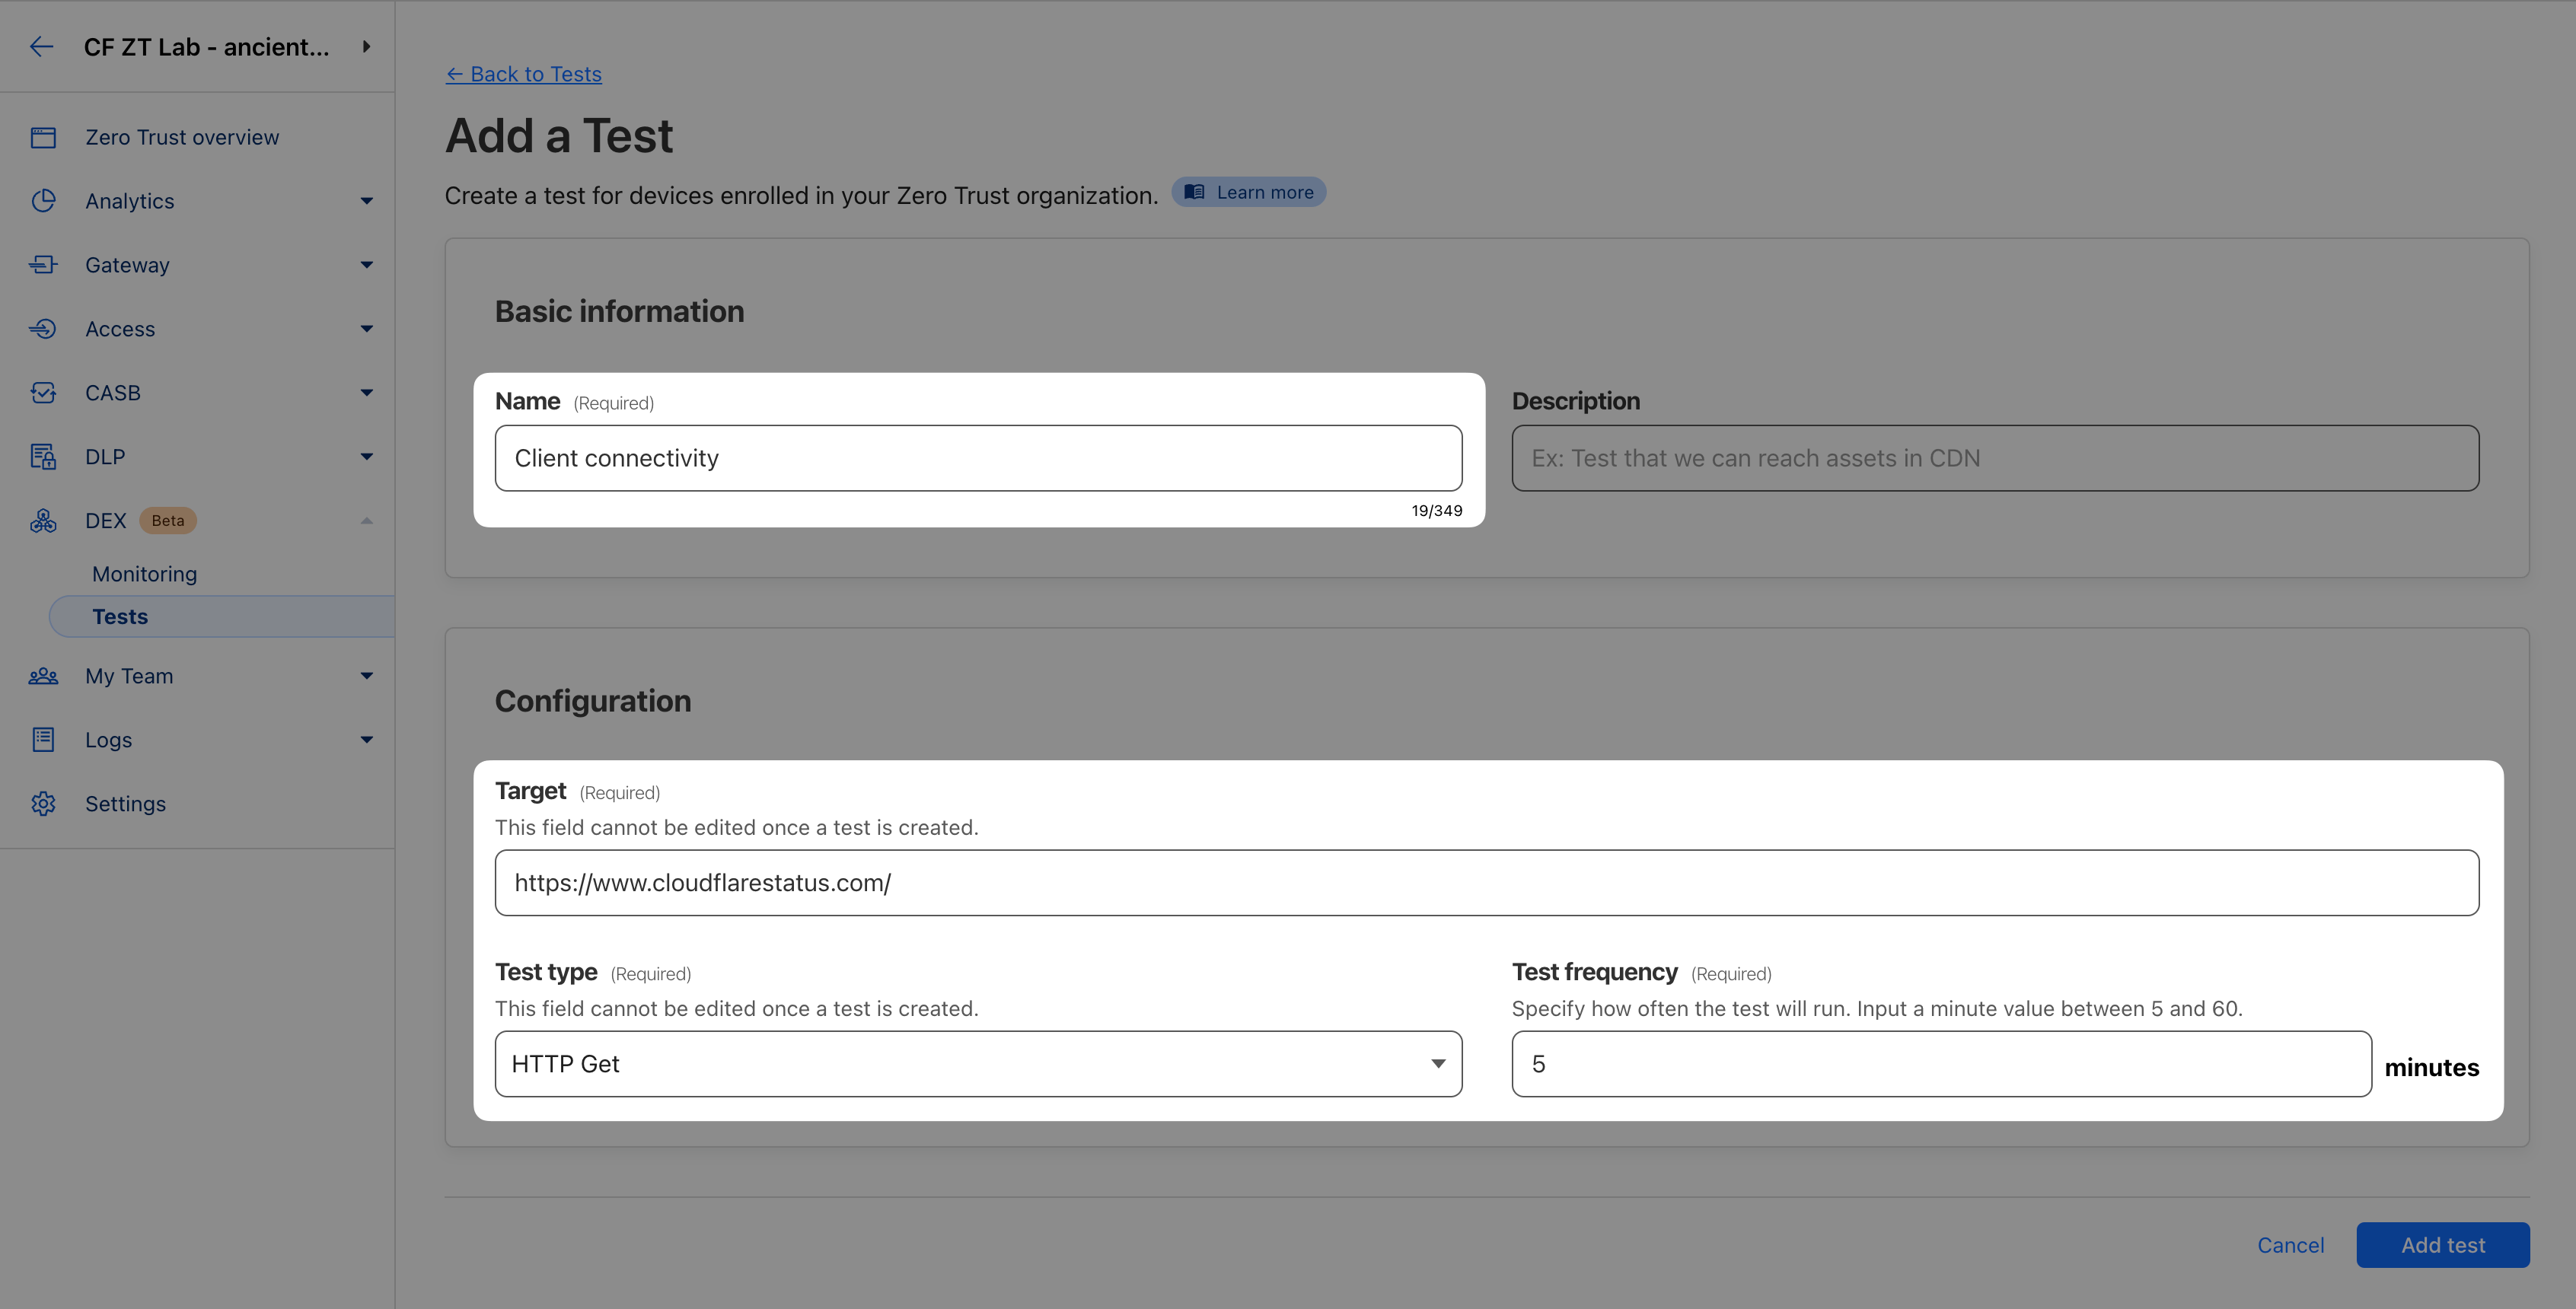
After some time, head back to DEX ‣ Monitoring and switch to the Tests tab. You should see the test results coming in.
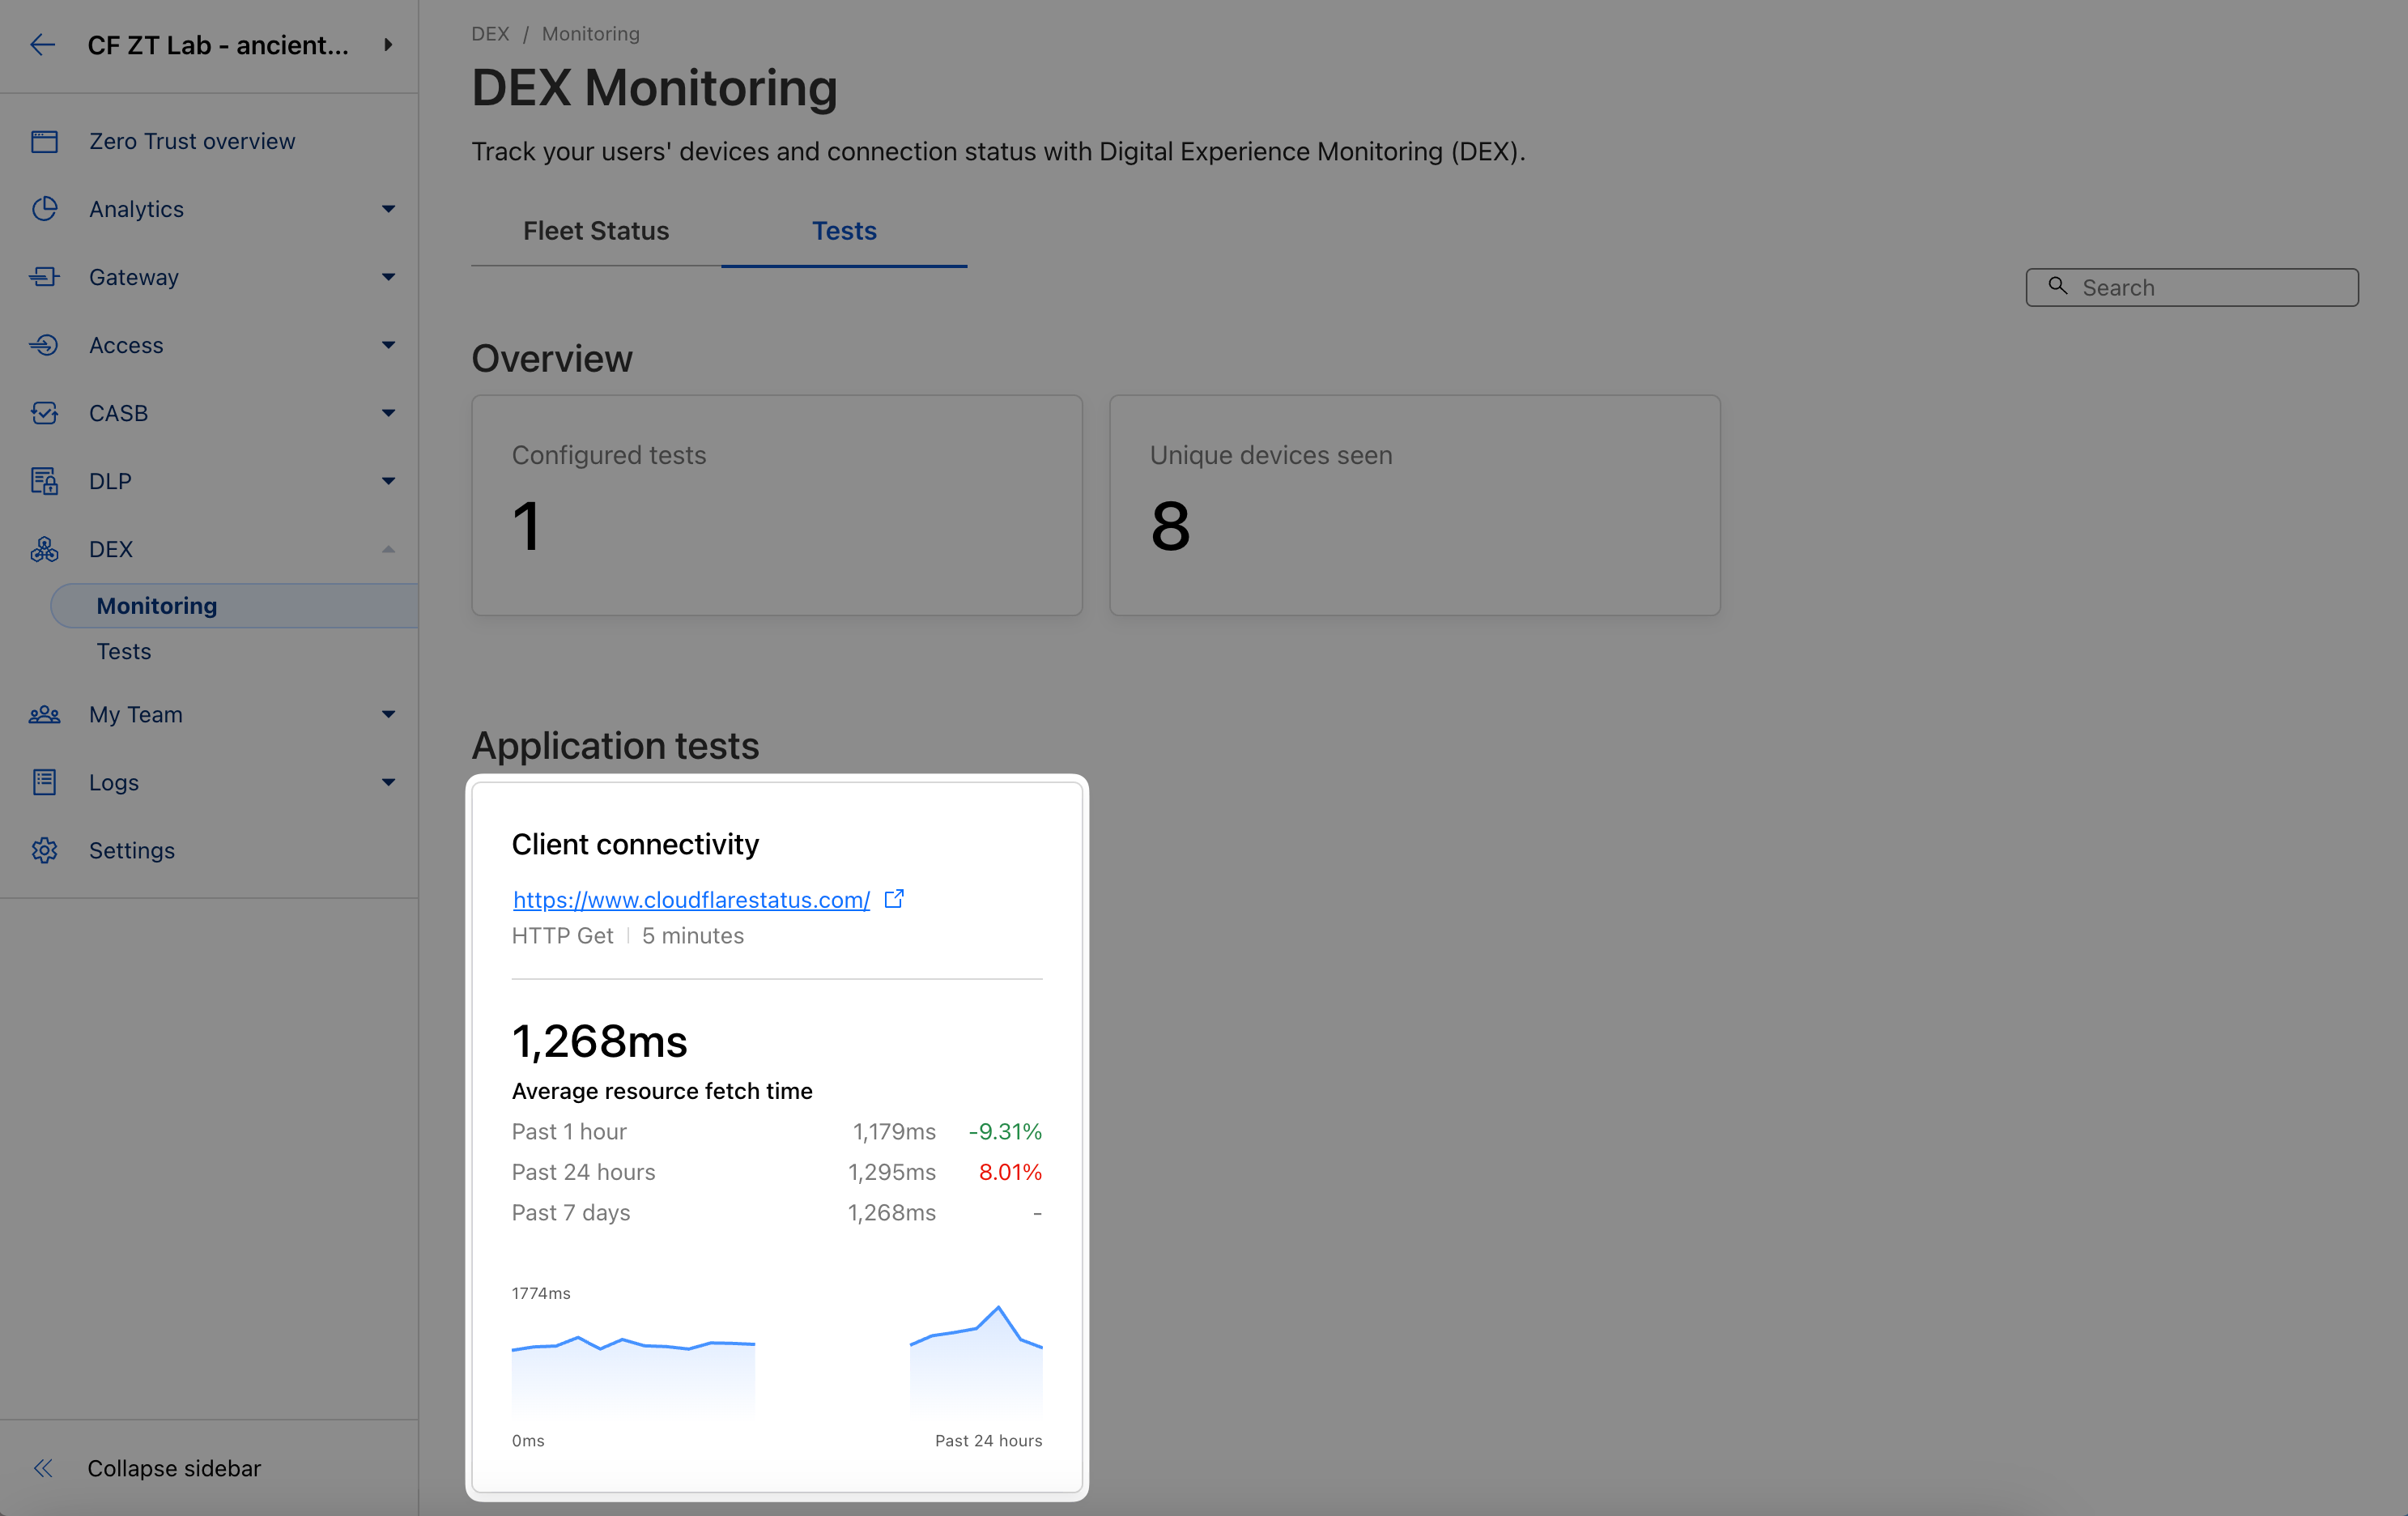
Clicking on the test’s tile reveals more details.
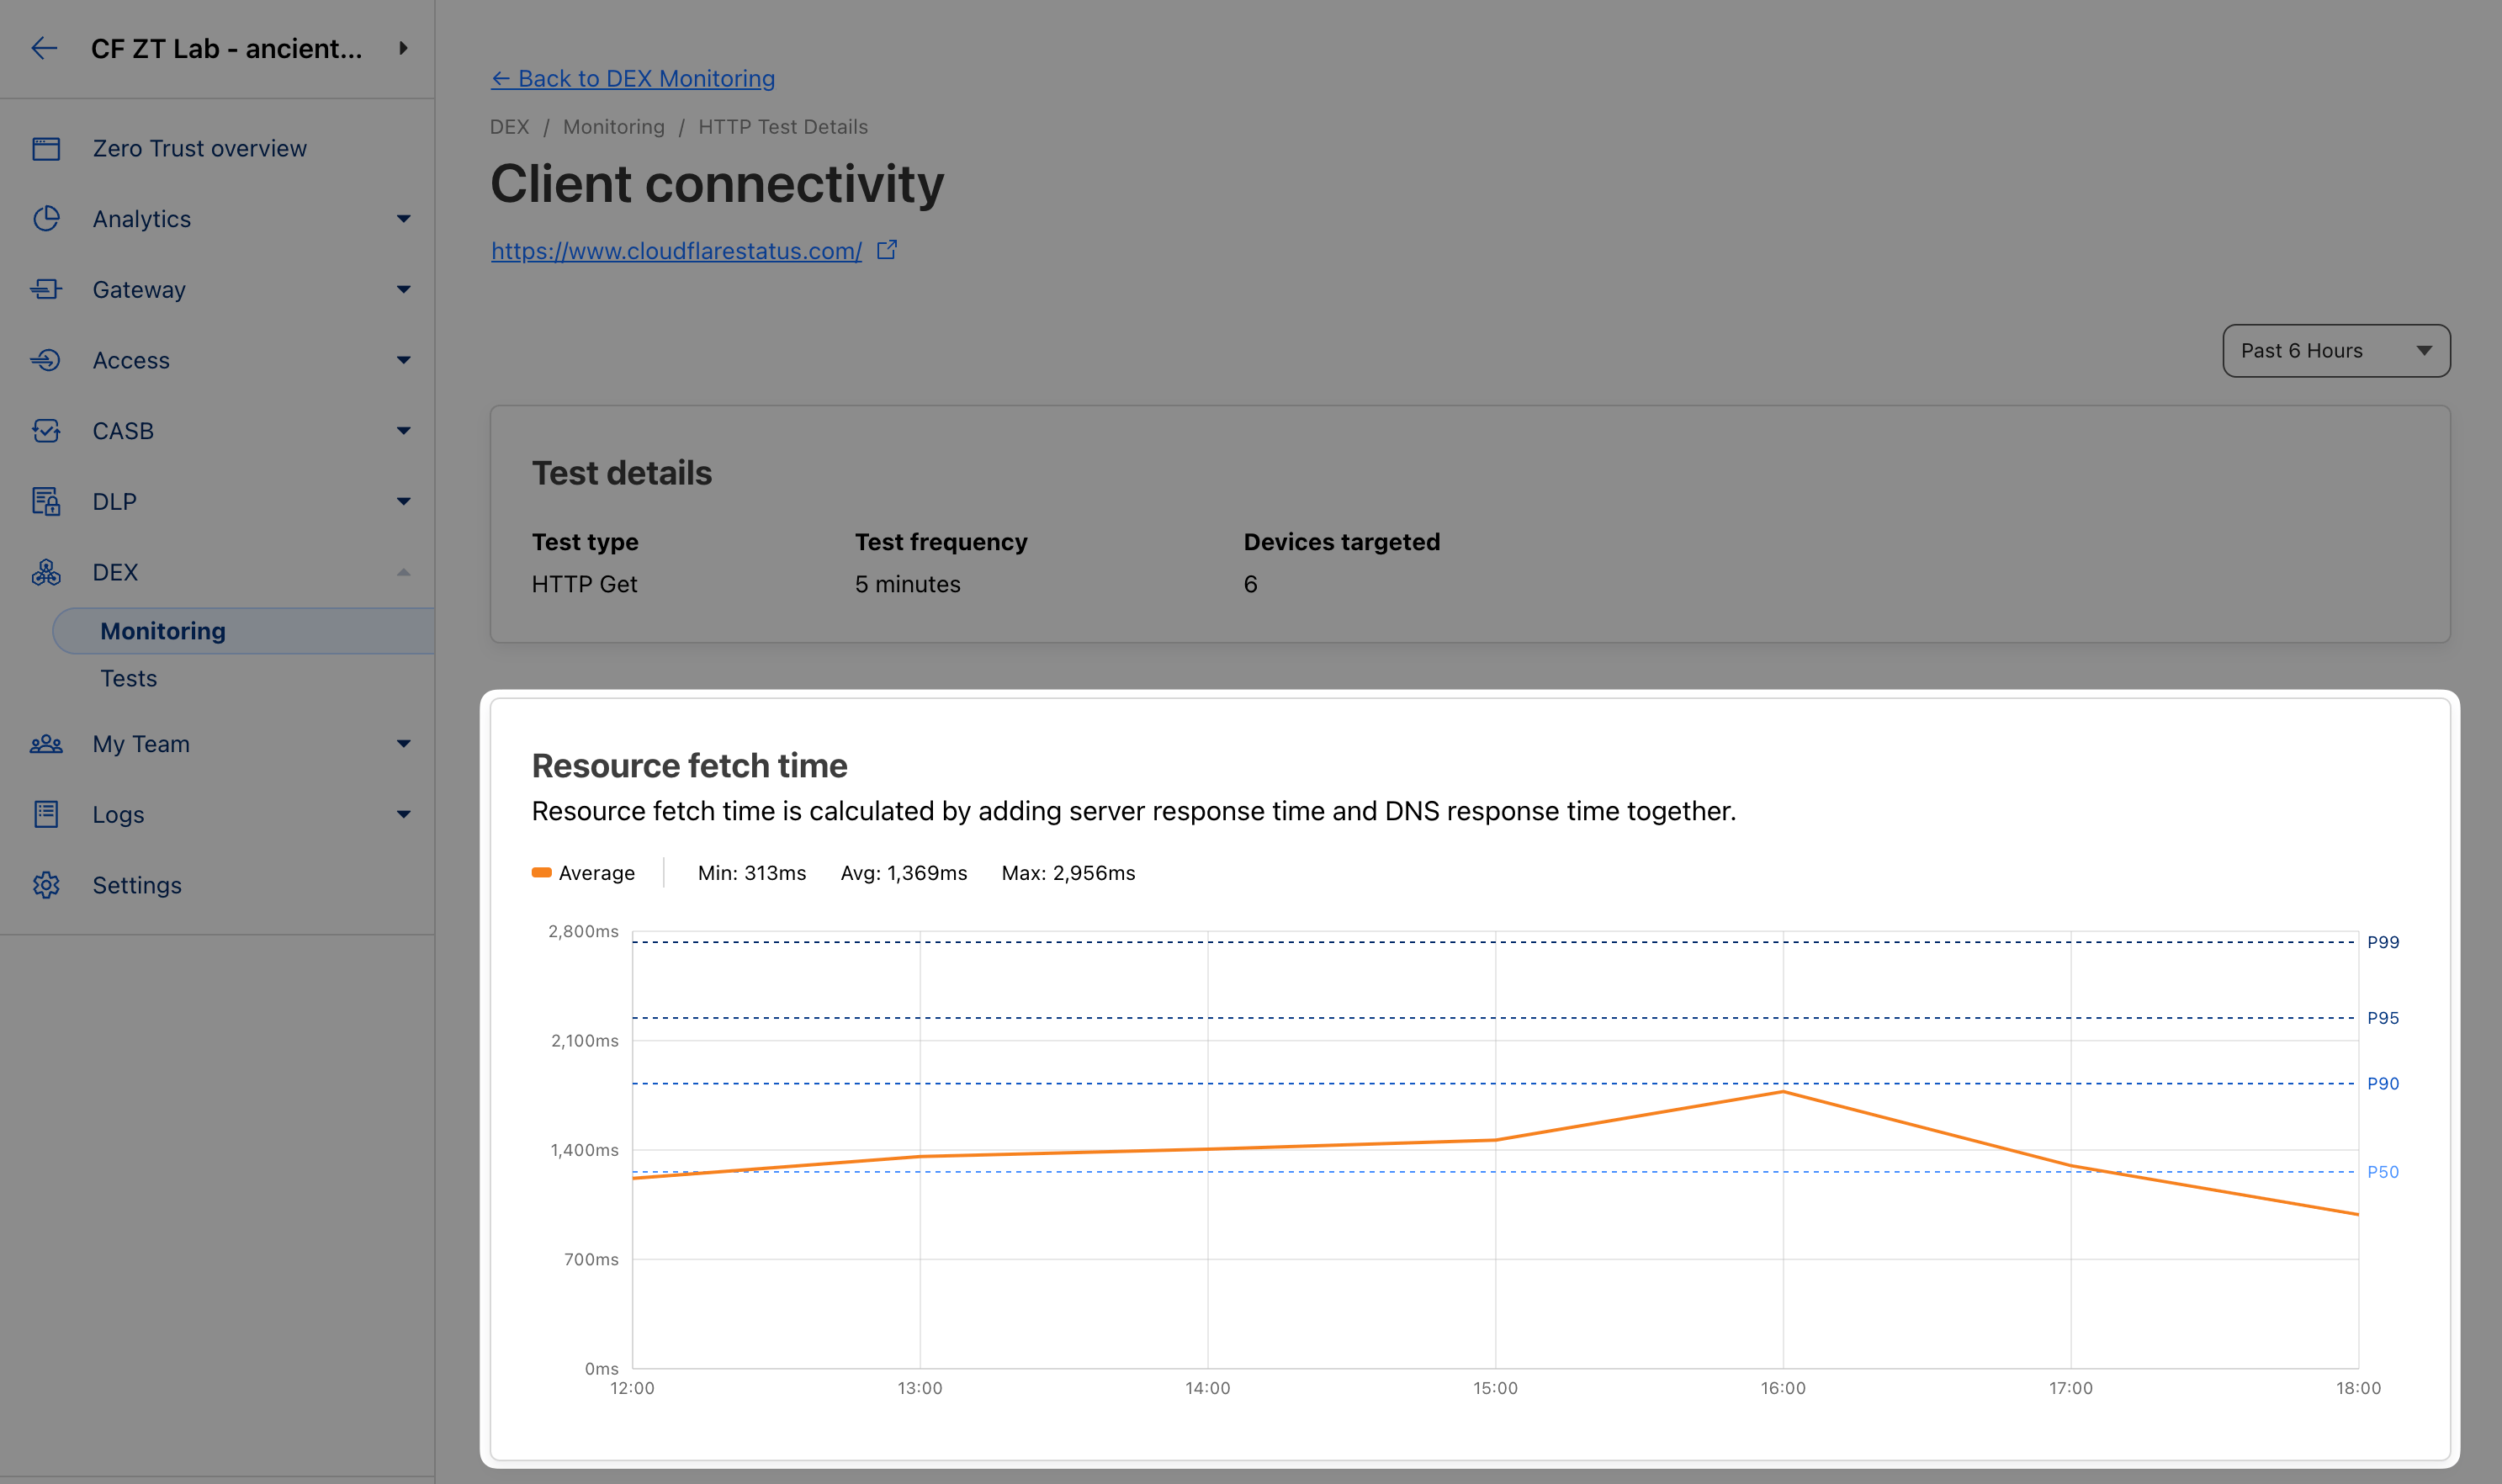
The above statistics are averaged results across all of your WARP clients in the field. But what if you want to troubleshoot a specific client, say if a specific employee complains about a poor experience?
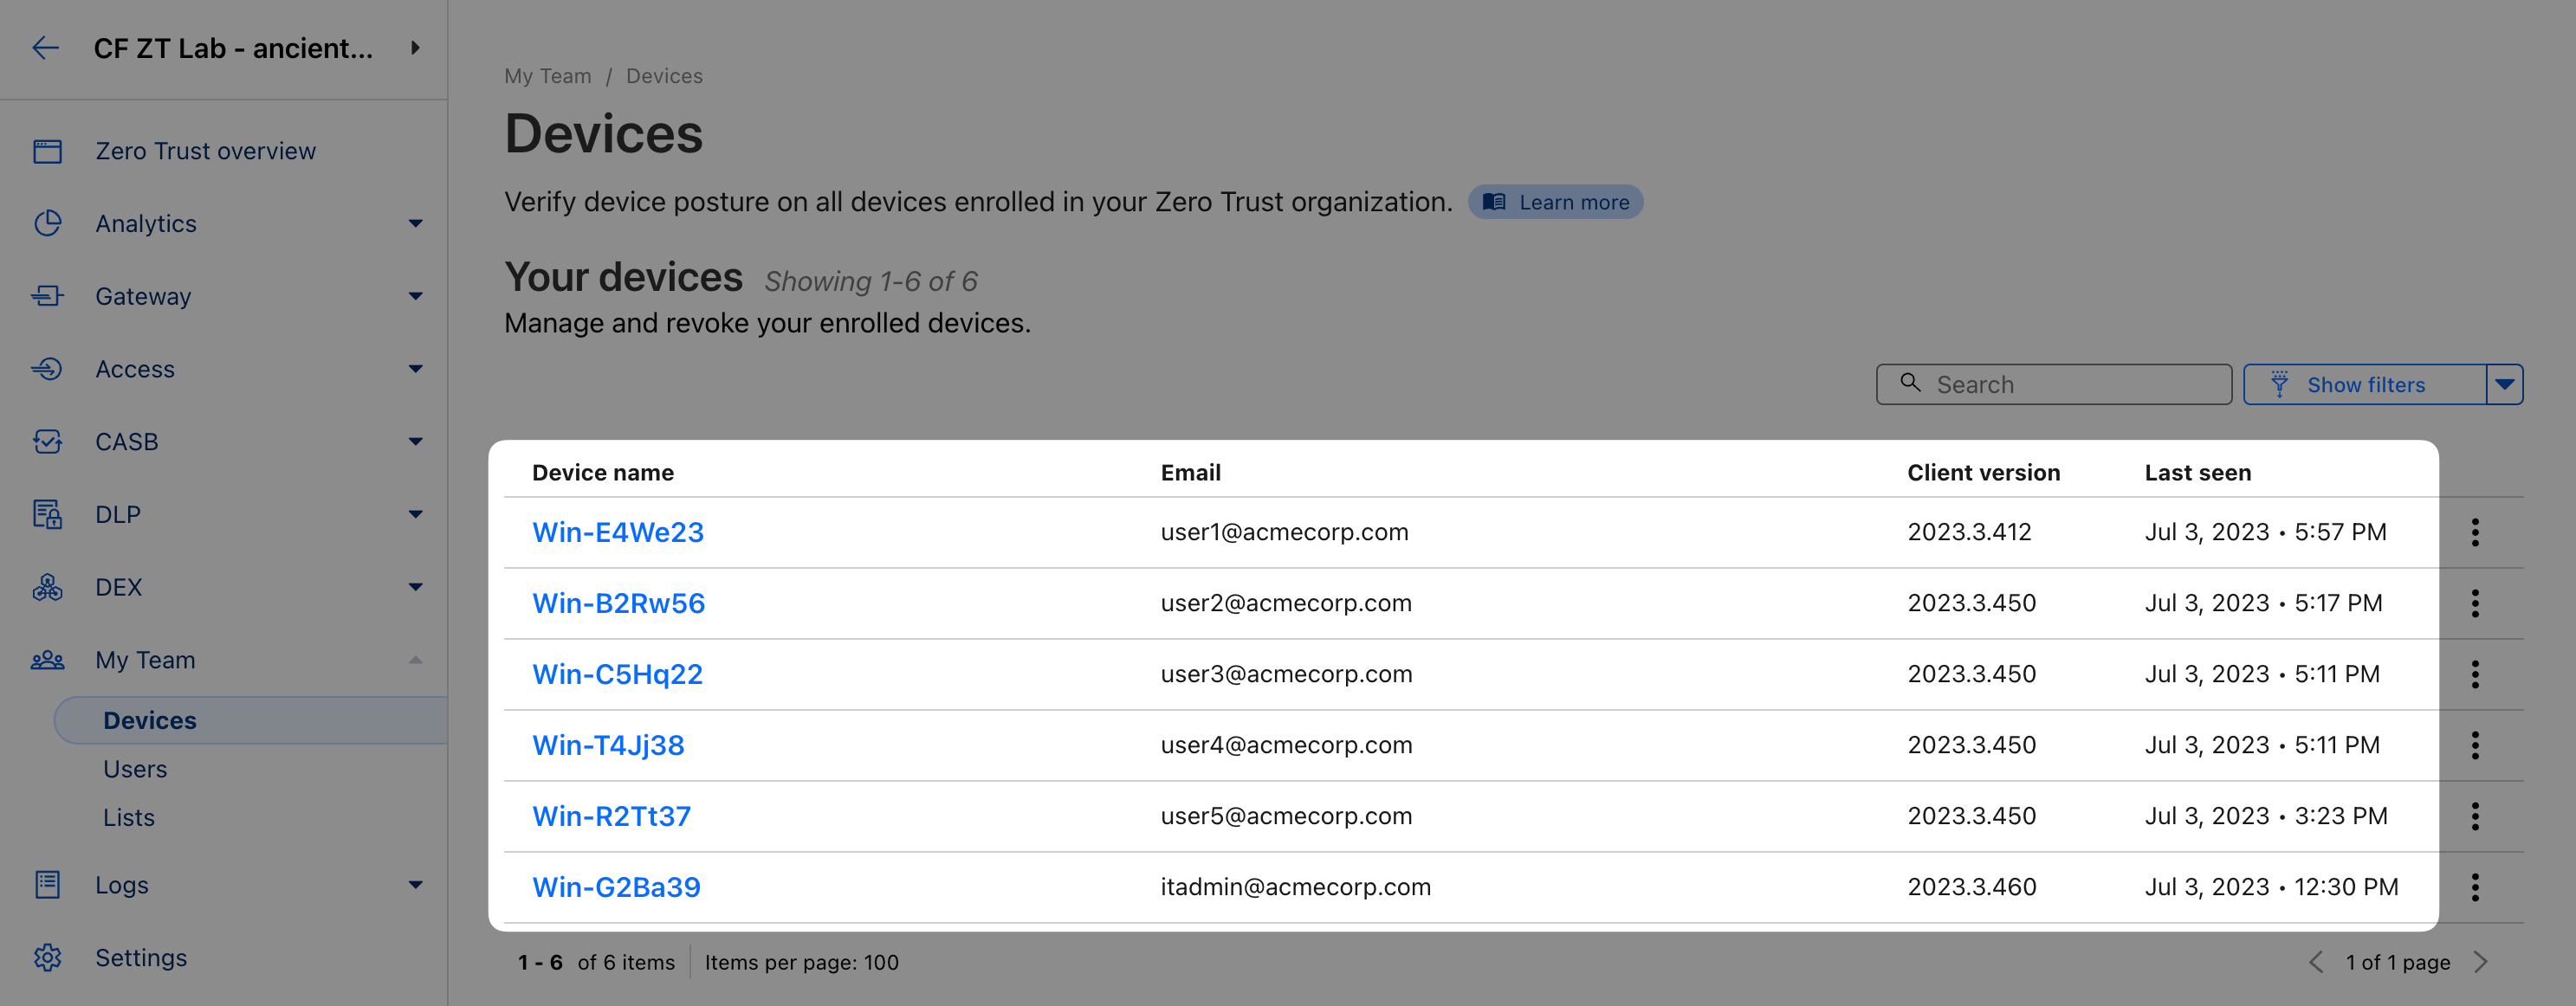
DEX statistics are also available per device. Navigate to My Team ‣ Devices and select one of your devices.
Client-specific DEX stats are available in the Fleet Status and Tests tabs.
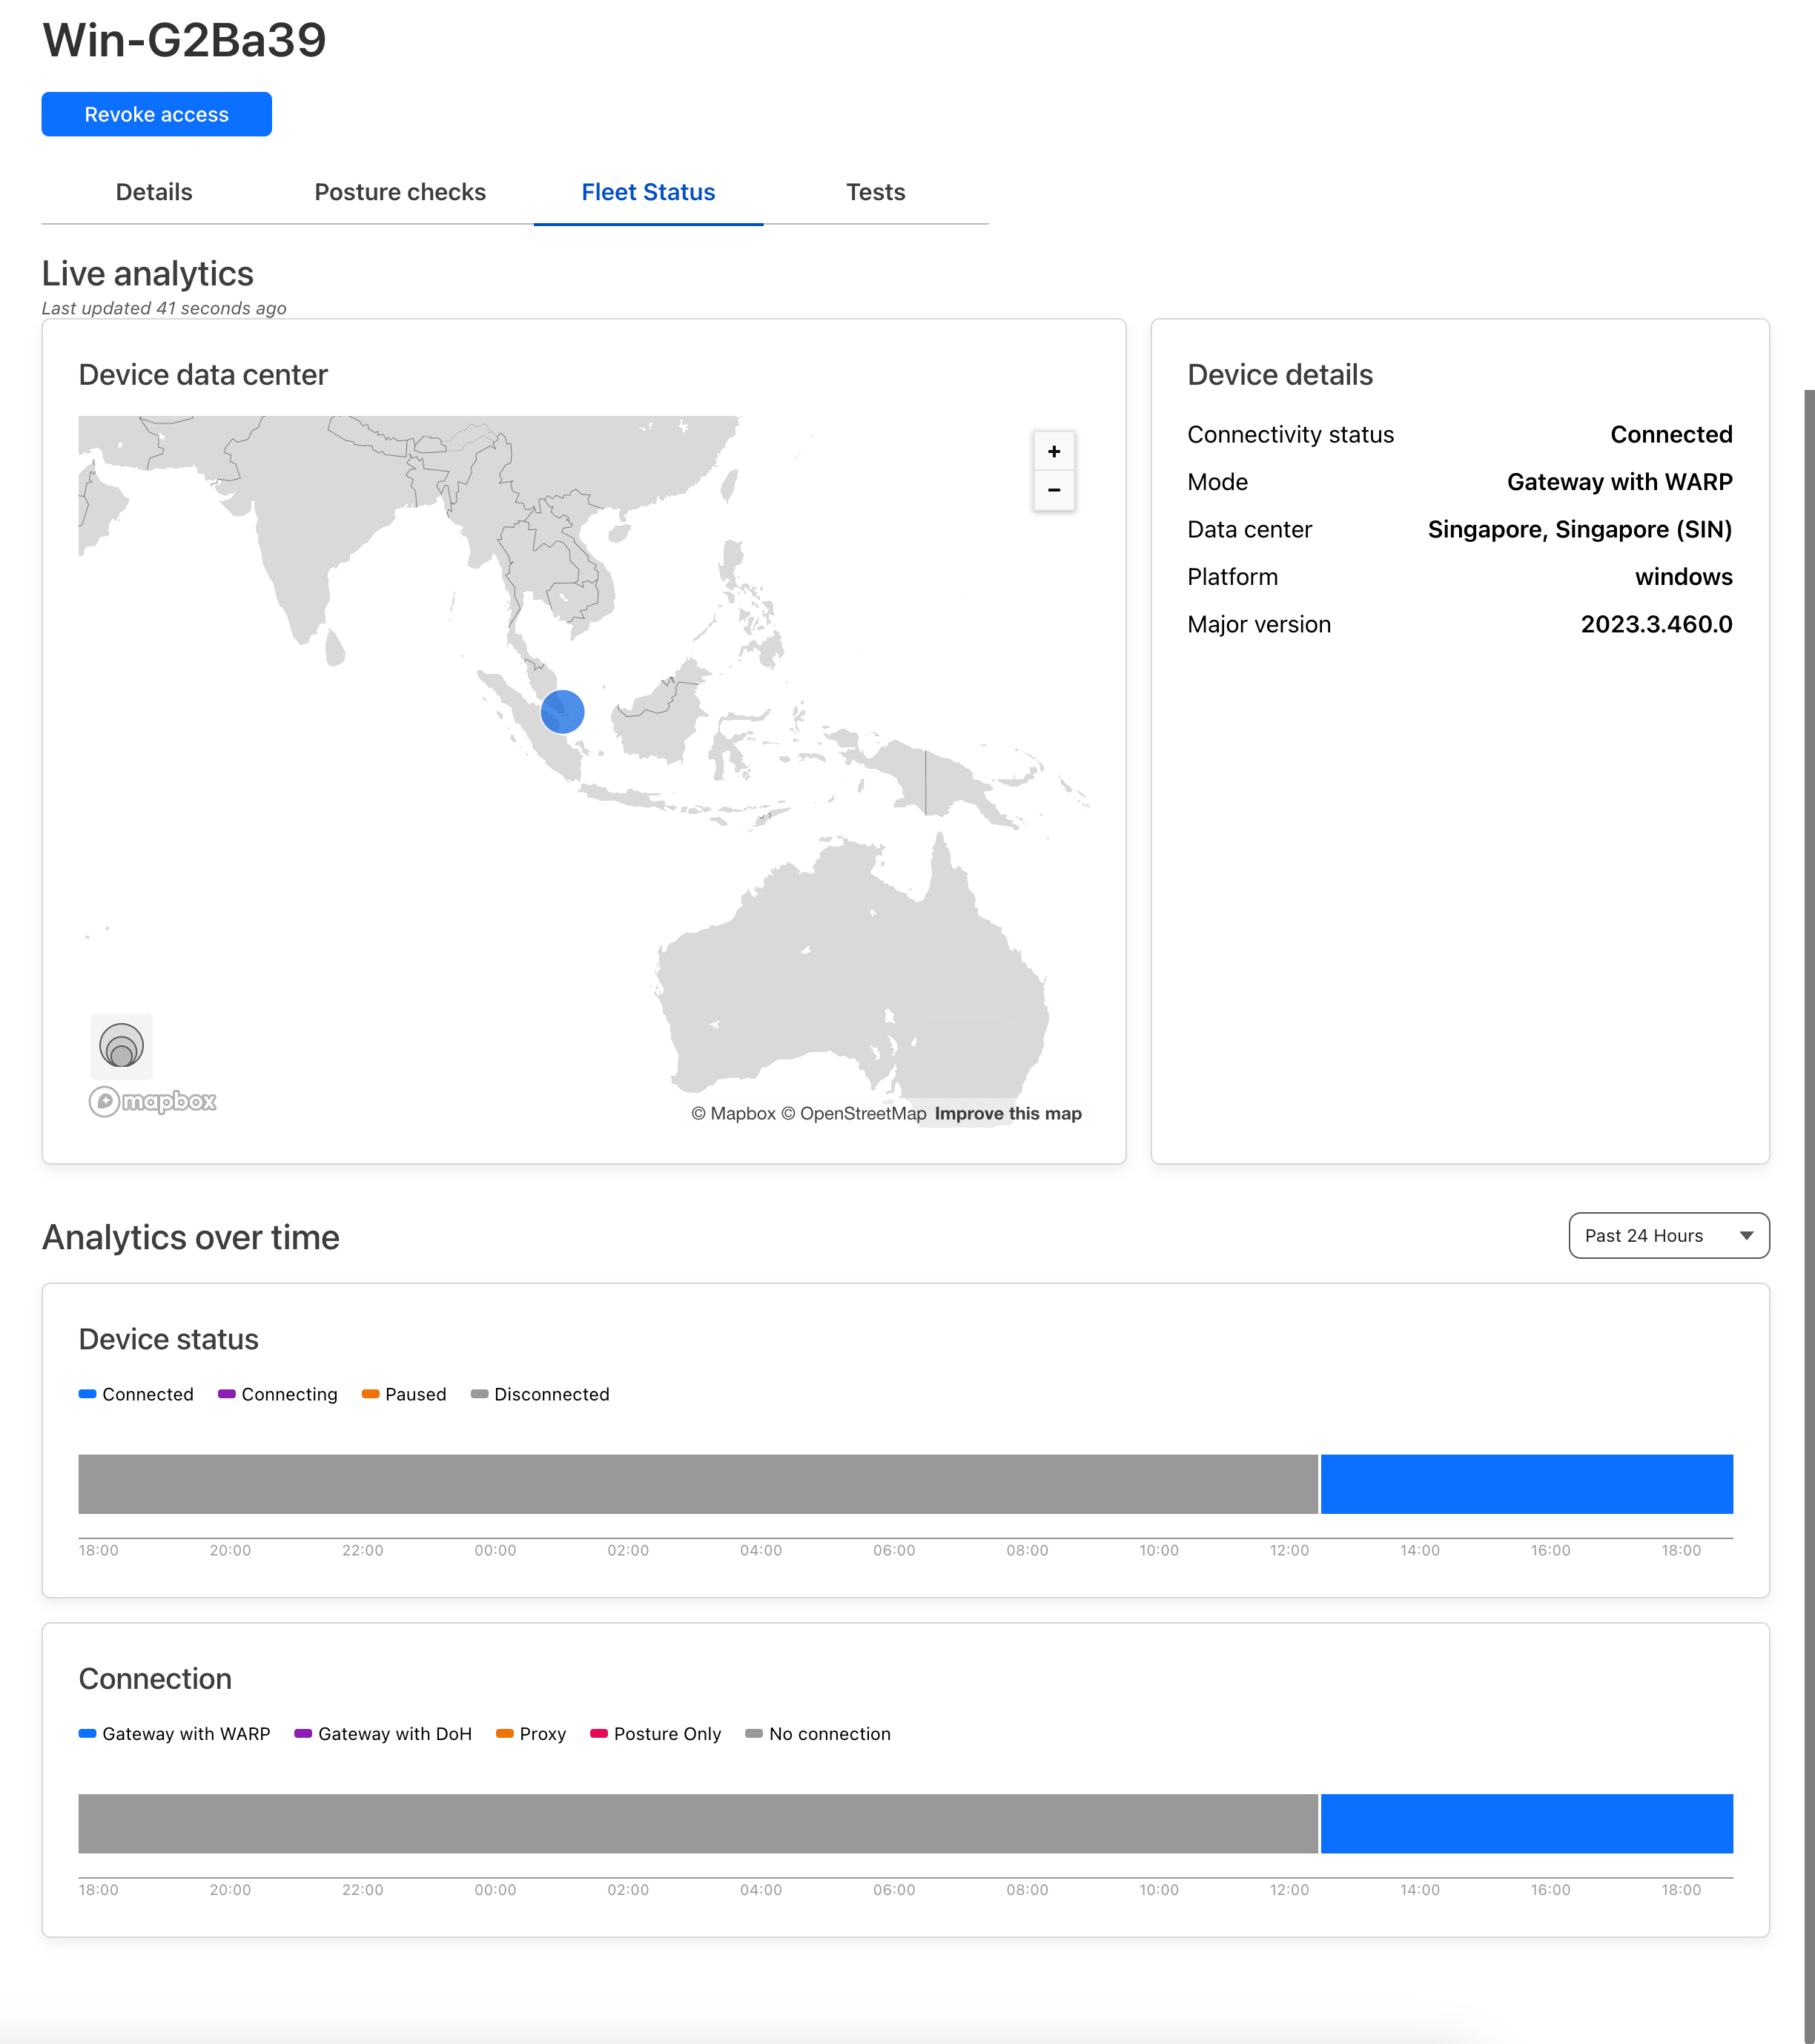
Note for example the Device status timeline which captures the client’s connection state over time.