Troubleshooting
In this troubleshooting section, we aim to guide you through two methods for troubleshooting incidents or unexpected behaviors that may arise due to misconfigured settings or traffic anomalies.
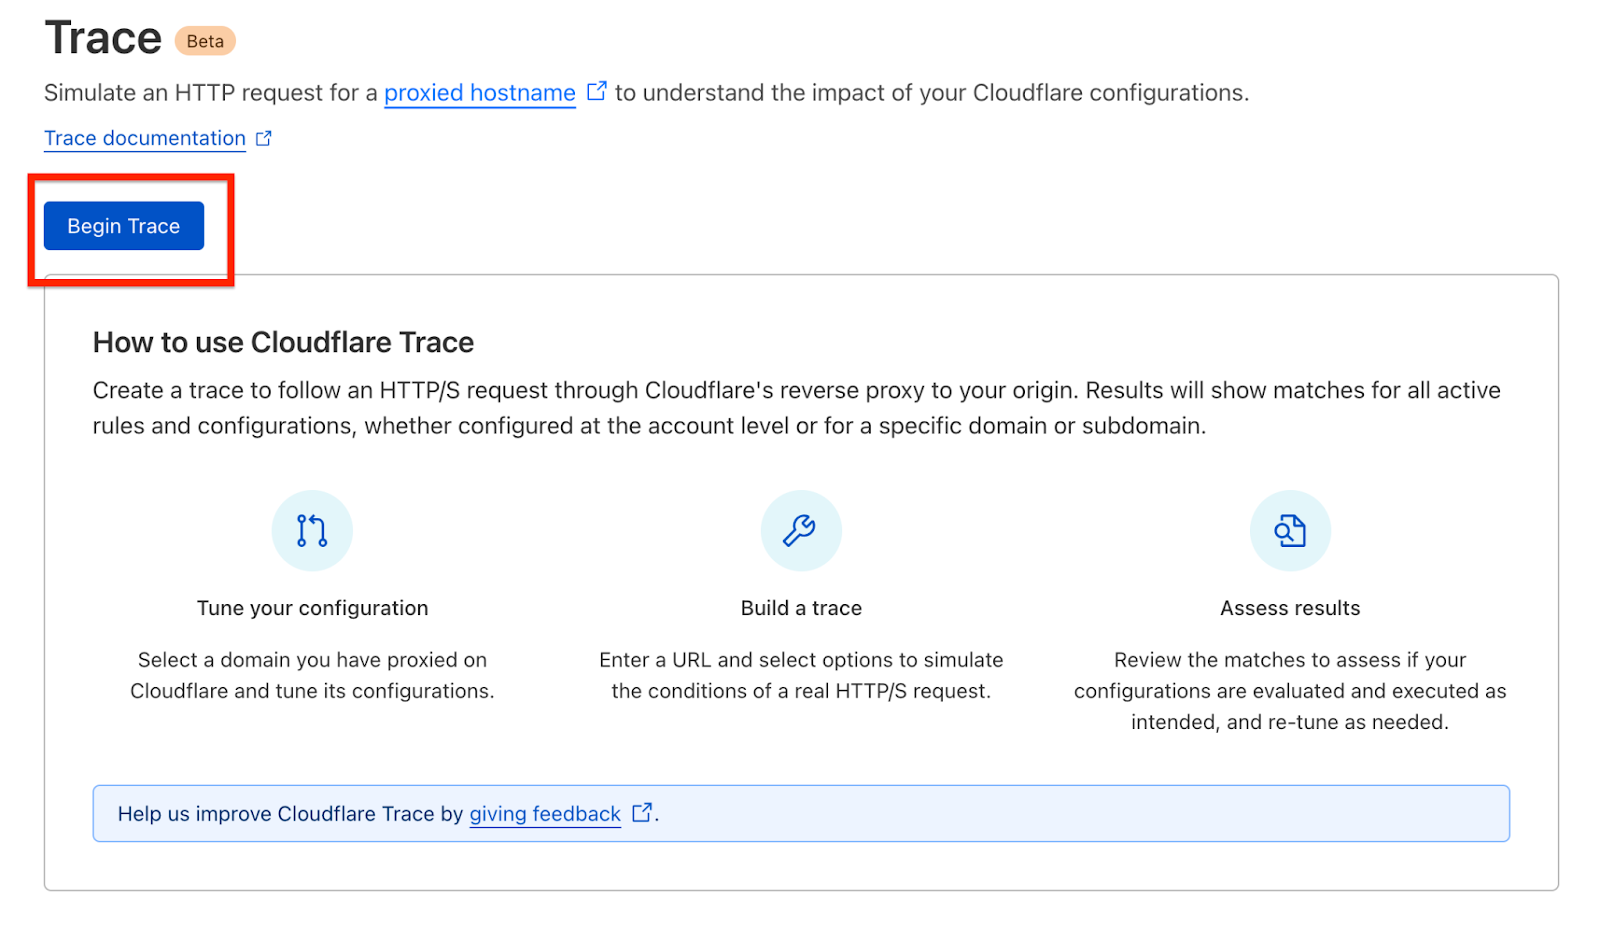
Cloudflare Trace
Cloudflare Trace (beta) follows an HTTP/S request through Cloudflare’s reverse proxy to your origin. Use this tool to understand how different Cloudflare configurations interact with an HTTP/S request for one of your hostnames. If the hostname you are testing is not proxied by Cloudflare, Cloudflare Trace will still return all the configurations that Cloudflare would have applied to the request.
You can define specific request properties to simulate different conditions for an HTTP/S request. Inactive rules configured in Cloudflare products will not be evaluated.
Cloudflare Trace is available to users with an Administrator or Super Administrator role.
Steps
- Using Administrator / Super Admin role, access Cloudflare Trace via Account > Trace > Begin Trace
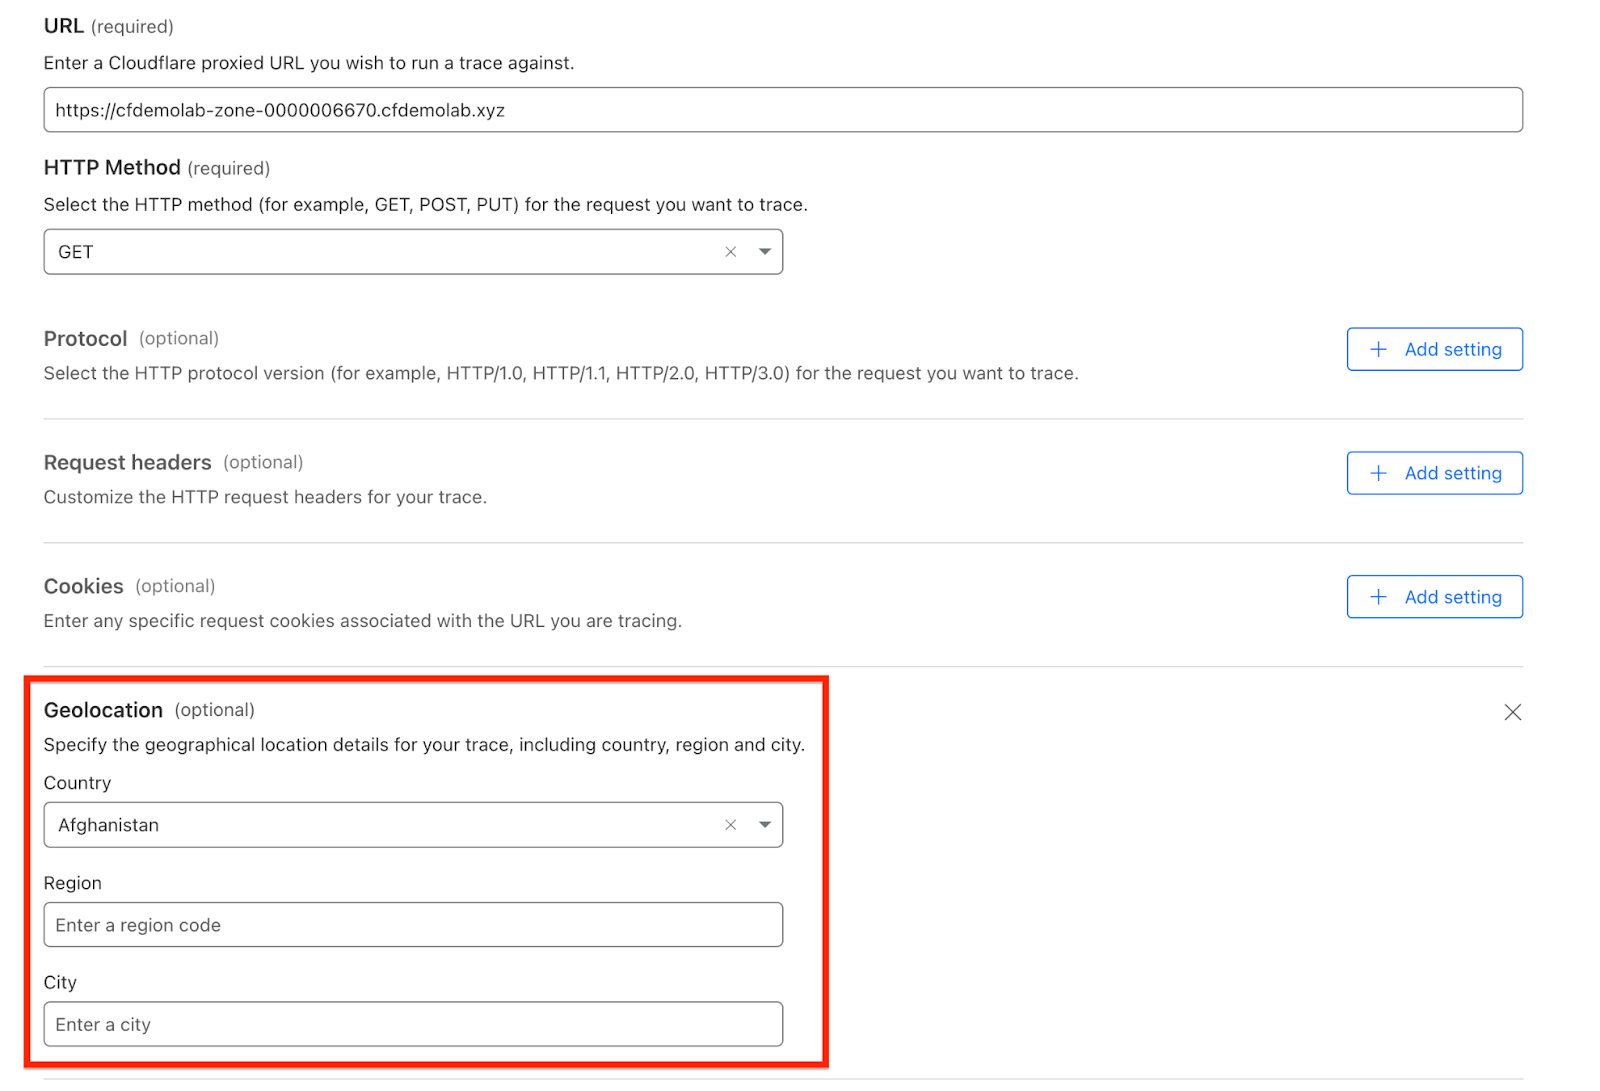
- Provide the corresponding URL in the URL field
Fill the url field on your zone / domain name via https:// scheme and click send trace
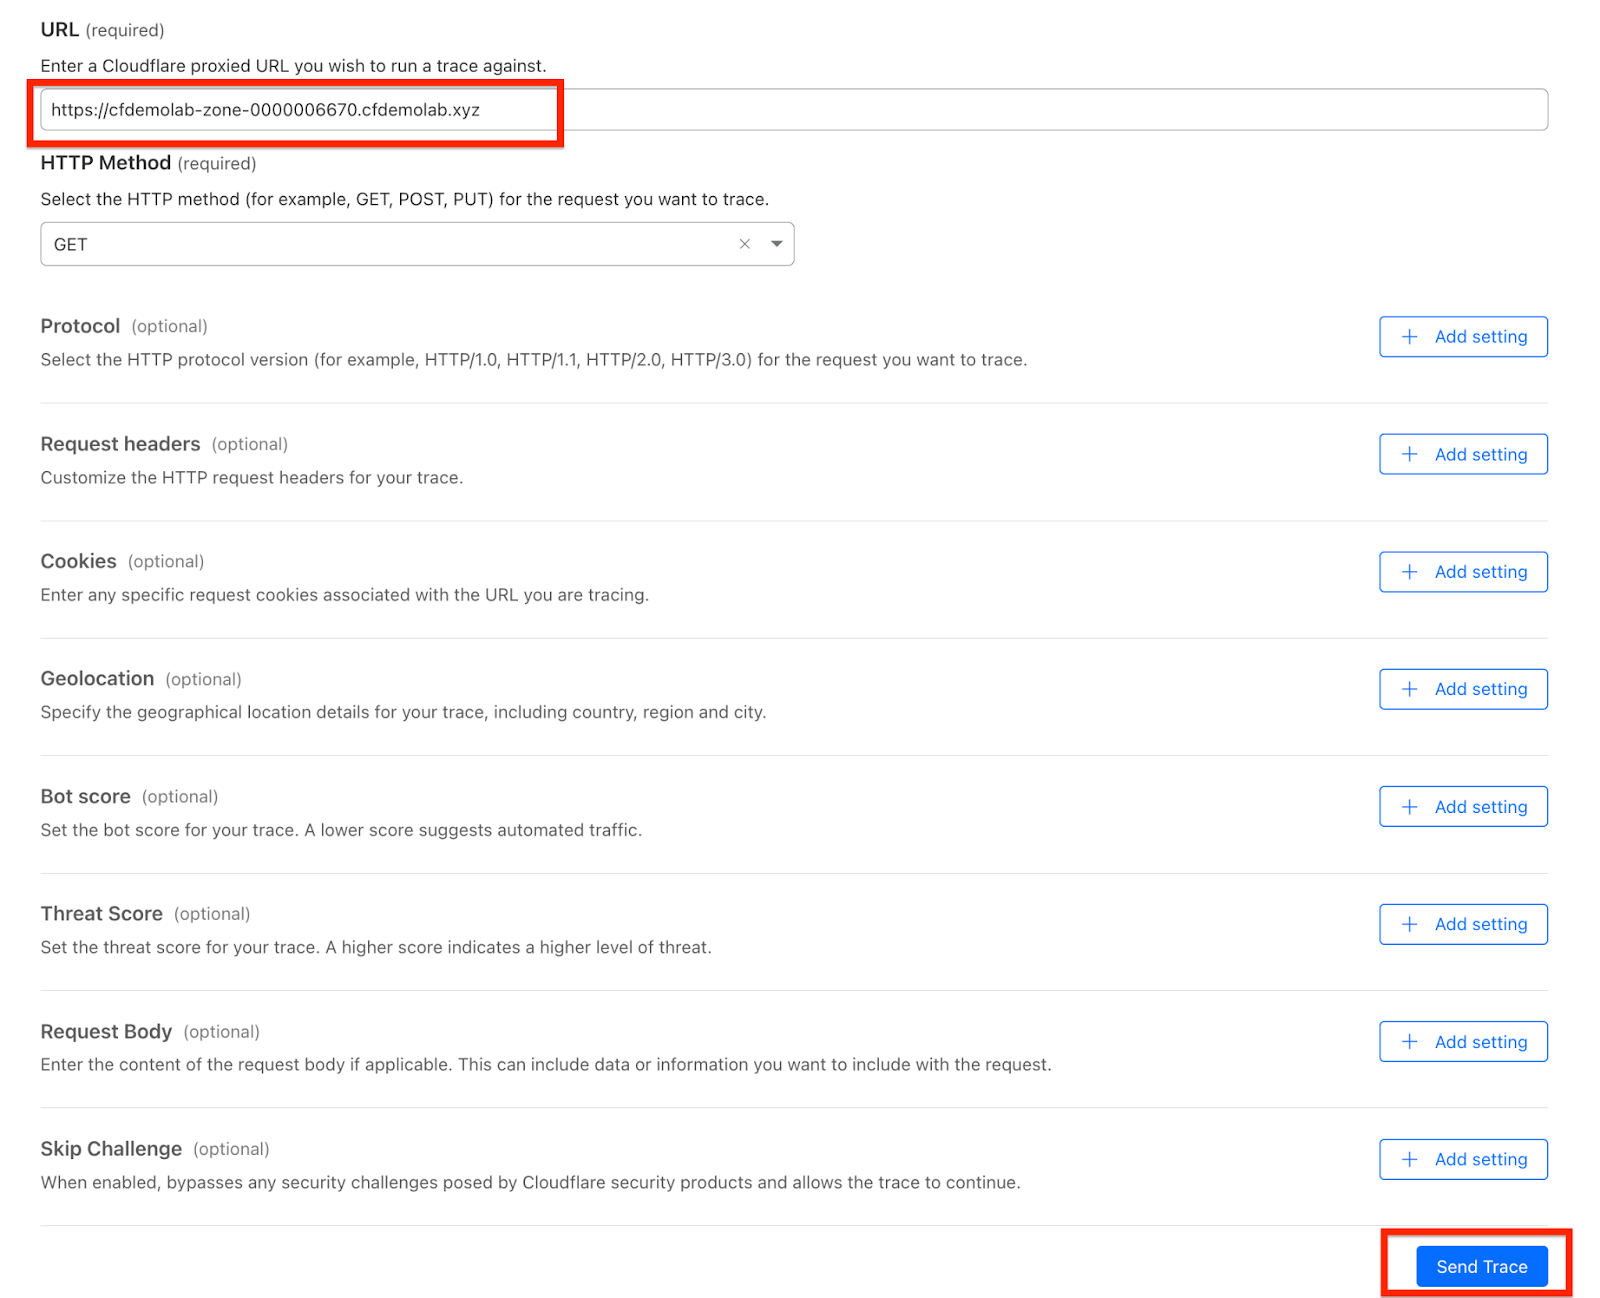
Without having any additional information provided in the remaining setting, it should not have any match expression with the other component inside Cloudflare settings and it will returns 200 OK
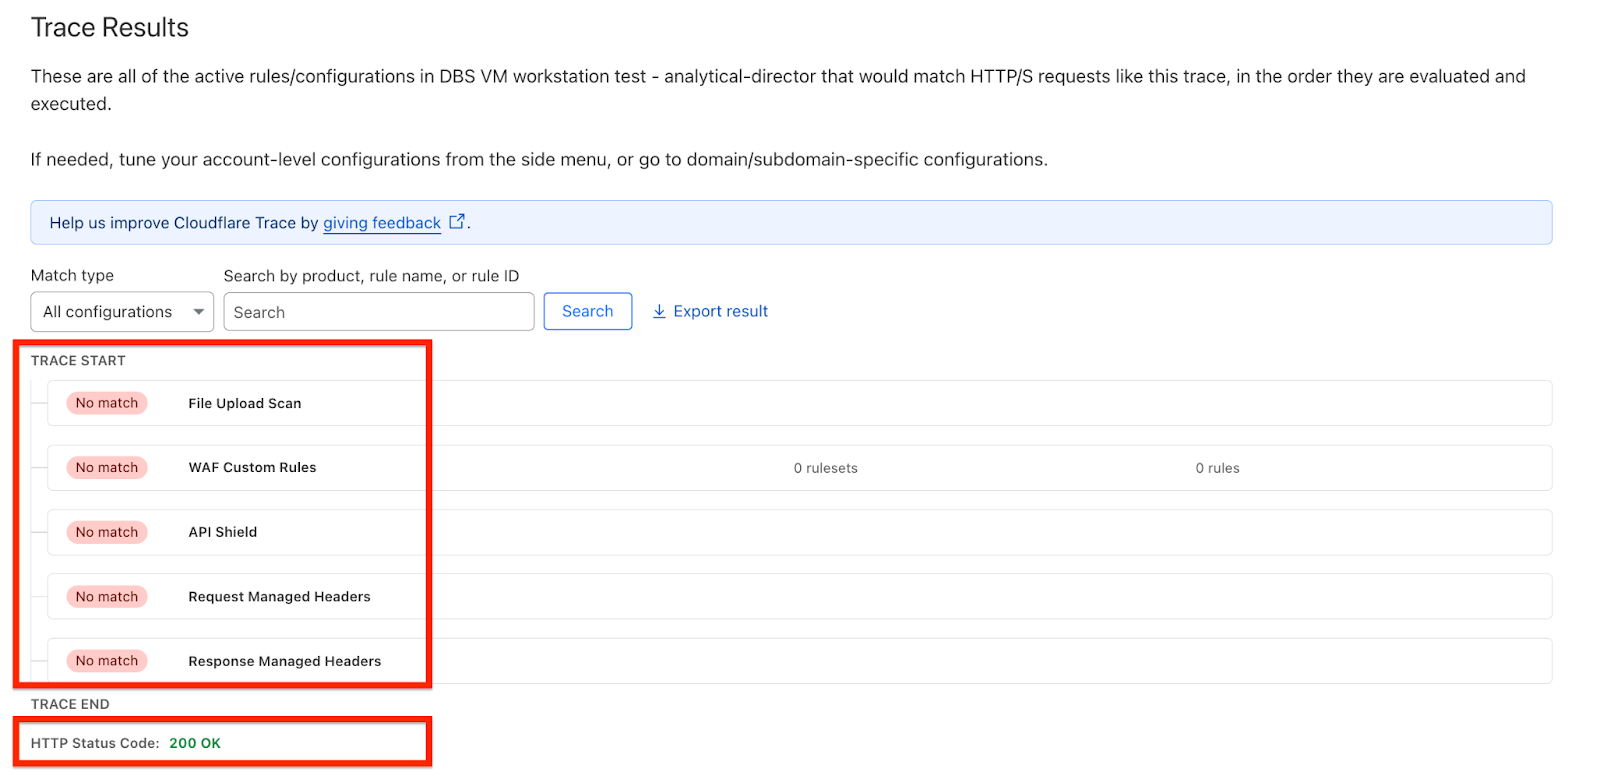
- Change the zone settings to match one of the trace component and see how it goes
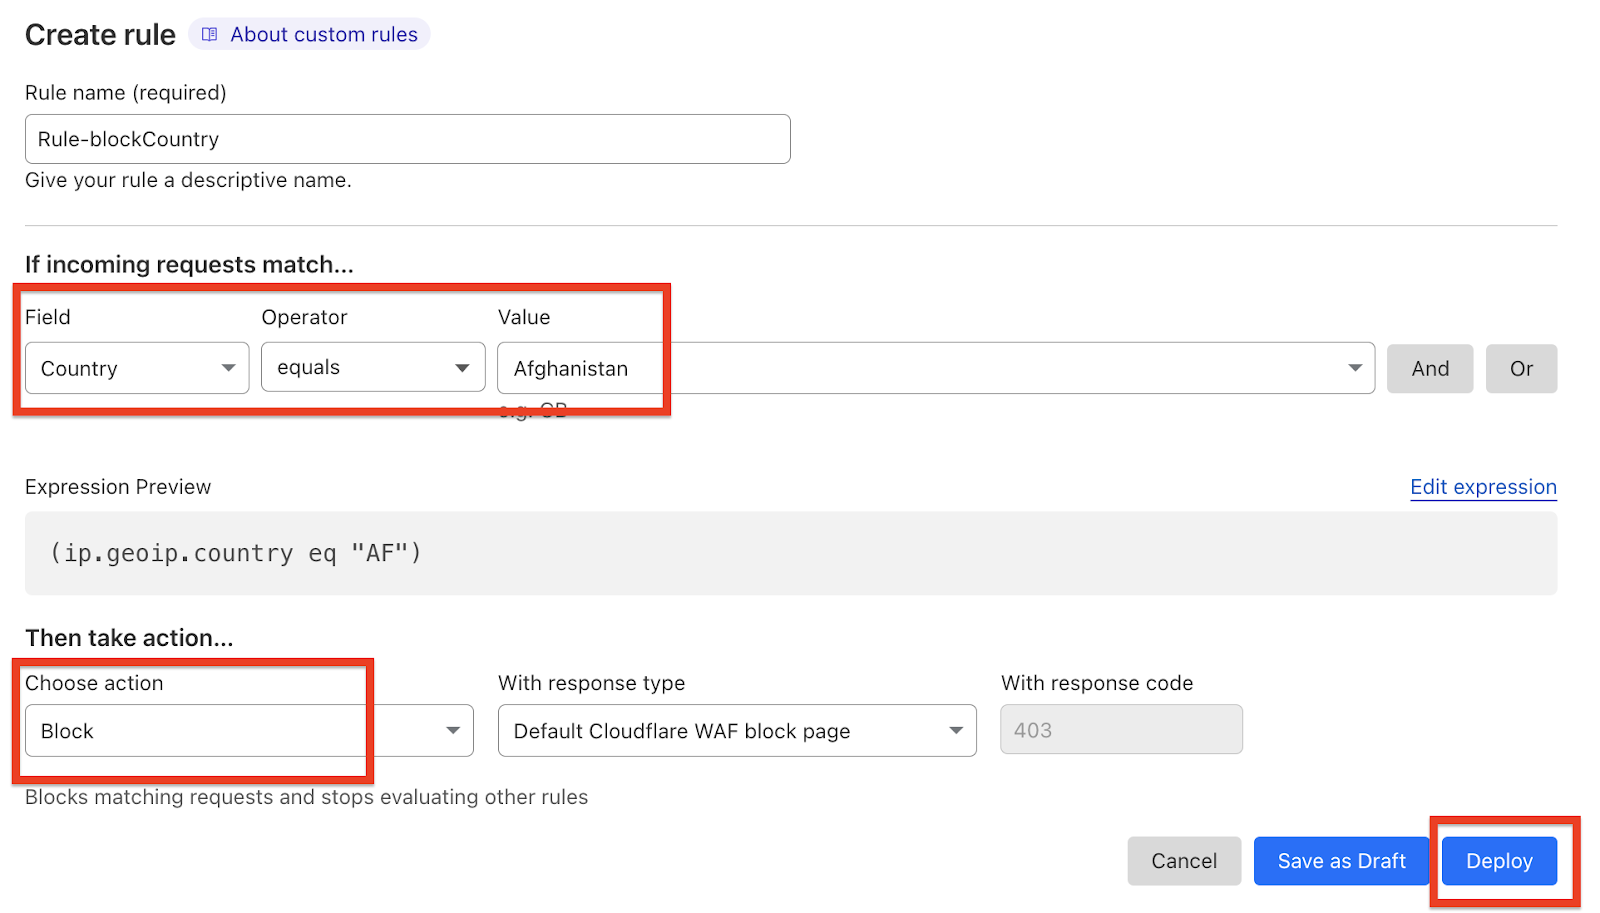
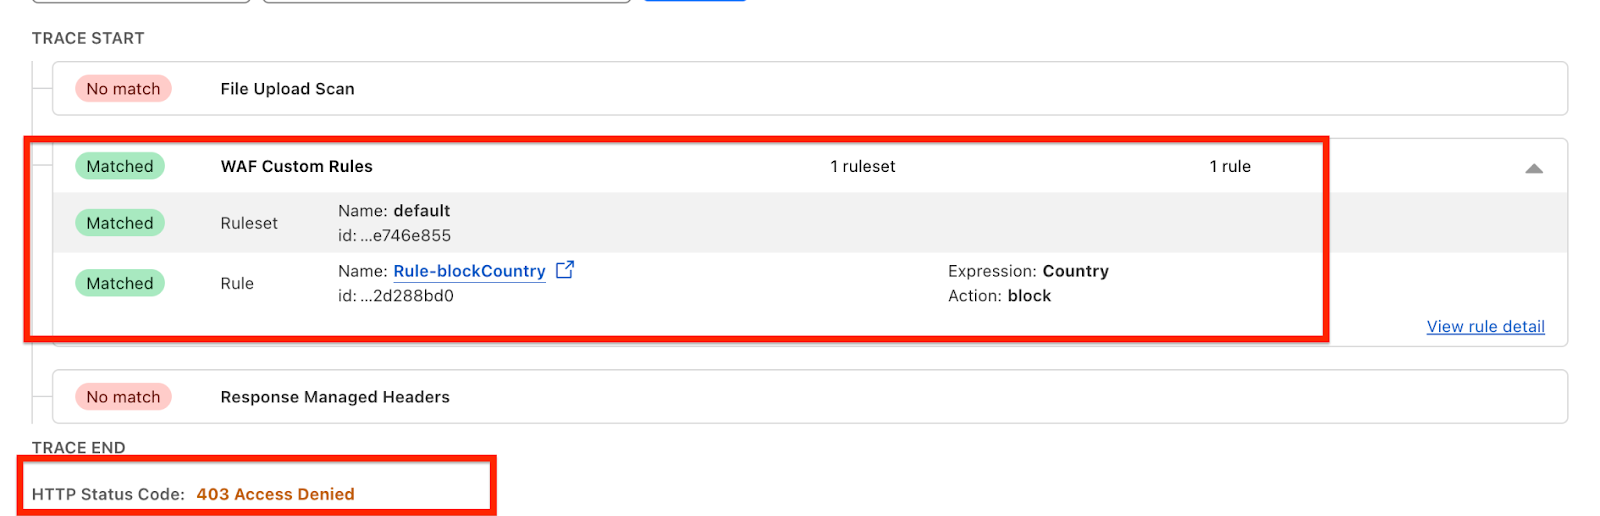
Create a zone level custom rule to block traffic from Afghanistan in Security > WAF > Custom Rules
- Run the trace again with the additional Geolocation Country = Afghanistan to trigger the trace result and output
We can see that the trace of this traffic match with Custom Rules and resulted to 403 during the end of trace
Limitation
Currently, you cannot perform traces for:
- Spectrum applications
- Hostnames using Data Localization Suite
Also, the following products will not appear in trace results:
Instant Logs
Instant Logs allows Cloudflare customers to access a live stream of the traffic for their domain from the Cloudflare dashboard or from a command-line interface (CLI). Seeing data in real time allows you to investigate an attack, troubleshoot, debug or test out changes made to your network. Instant Logs is lightweight, simple to use and does not require any additional setup.
The filters you can add are ASN, Cache status, Country, Client IP, Host, HTTP method, Path, Status code, Firewall action matches, and Firewall rule ID matches. If you would like to filter on additional criteria, leave us feedback on the form linked on the Instant Logs page.
Once a filter is selected and the stream has started, only log lines that match the filter criteria will appear. Filters are not applied retroactively to logs already showing in the dash
Steps
- Access Instant Logs
Head over to the Analytics & Logs > Instant Logs in your zone / domain
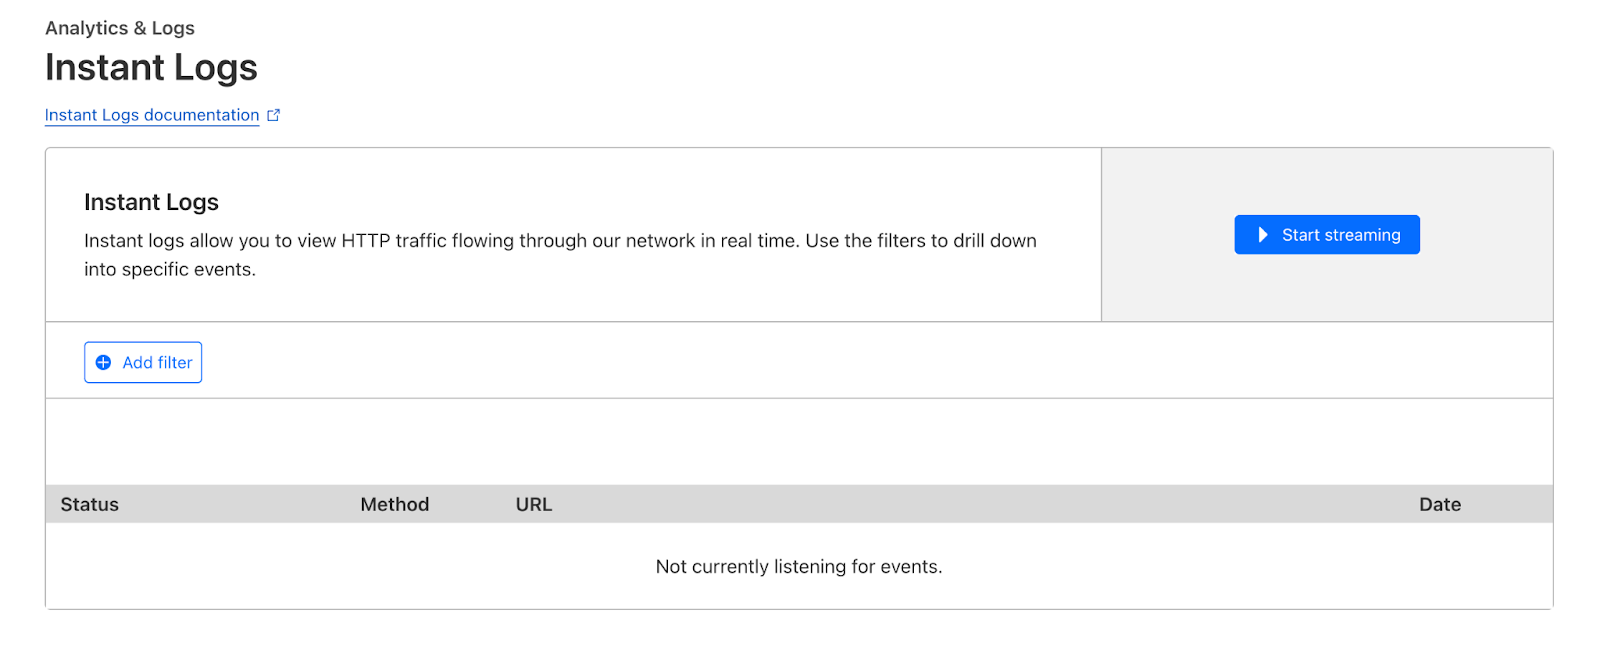
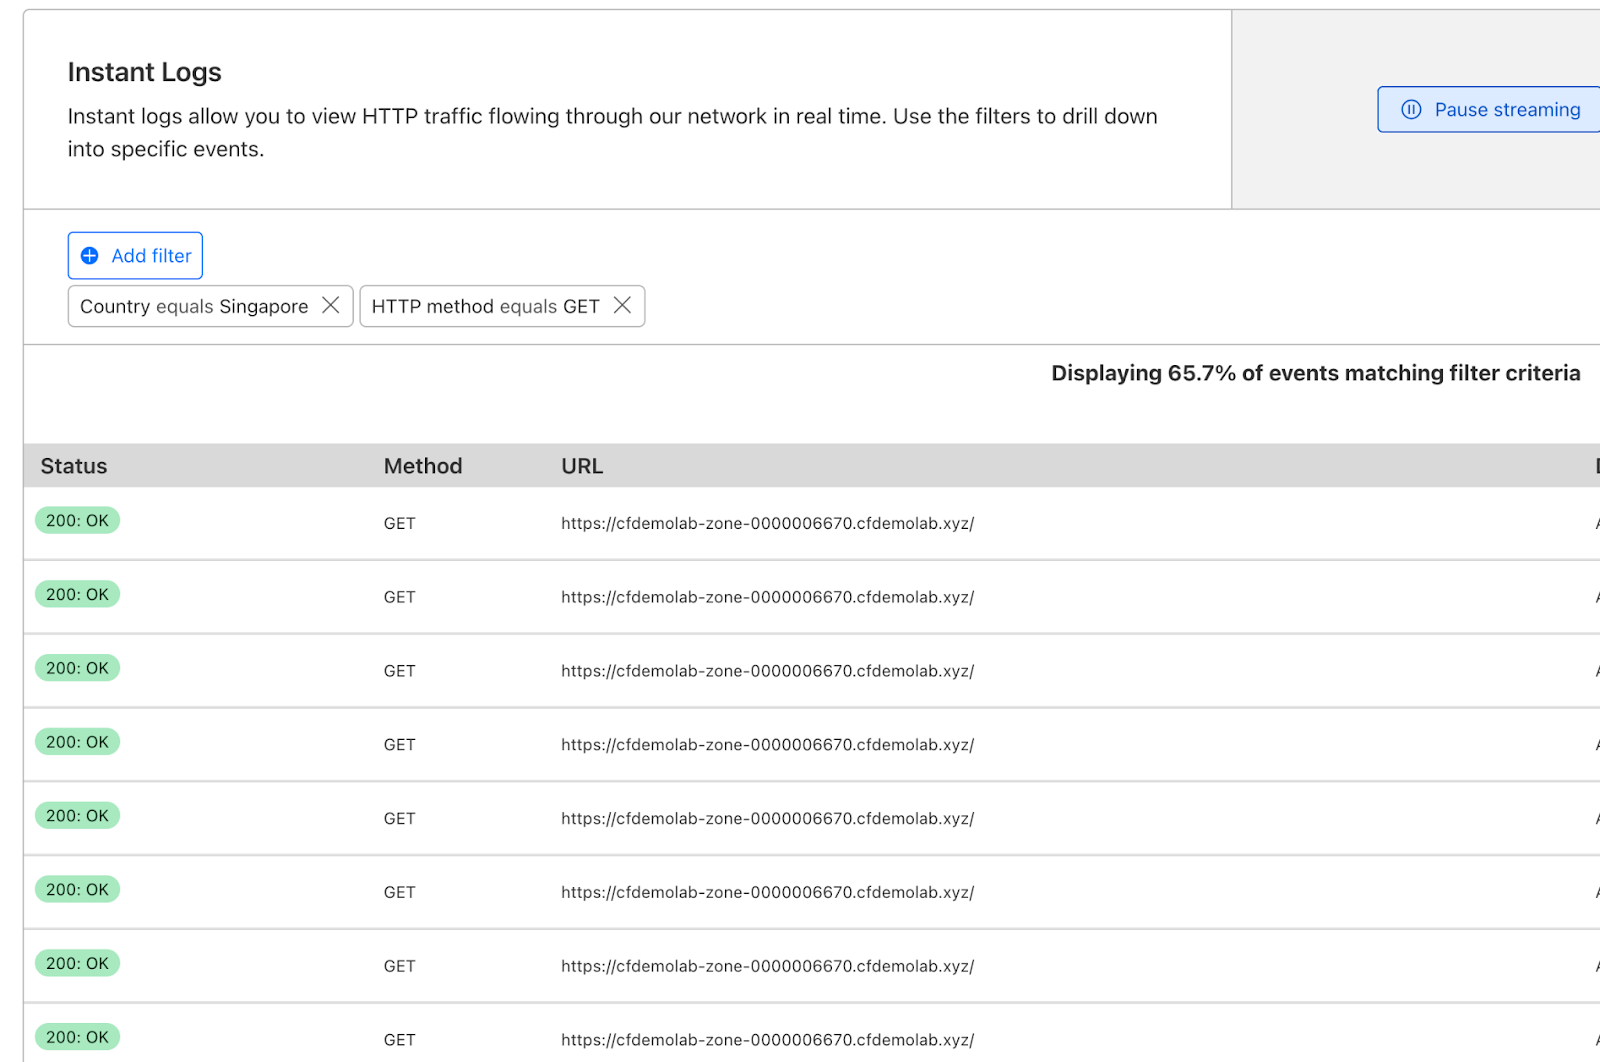
- Add filter to narrow down the traffic you want to investigate and observe, and click ‘Start Streaming’
run the same command again as what you did in WAF section :
Open your terminal and run a loop using curl or powershell (replace cfdemolab-zone-xxx with your own zone):
curl
$ for i in {1..10}; do curl -svo /dev/null "https://cfdemolab-zone-xxx.cfdemolab.xyz/services/safes/" 2>&1 | grep "HTTP.* "; done

< HTTP/2 200
< HTTP/2 200
< HTTP/2 200
< HTTP/2 200
< HTTP/2 200
< HTTP/2 429
< HTTP/2 429
< HTTP/2 429
< HTTP/2 429
< HTTP/2 429
Powershell
PS> for (($i = 0); $i -lt 10; $i++) { try { $Response = Invoke-WebRequest -Uri "https://cfdemolab-zone-xxx.cfdemolab.xyz/services/safes/"; $StatusCode = $Response.StatusCode } catch { $StatusCode = $_.Exception.Response.StatusCode.value__ }; "#$i - $(Get-Date -Format "yyyy-MM-dd HH:mm:ss") - $StatusCode" }
#0 - 2023-10-30 08:50:25 - 200
#1 - 2023-10-30 08:50:25 - 200
#2 - 2023-10-30 08:50:25 - 200
#3 - 2023-10-30 08:50:25 - 200
#4 - 2023-10-30 08:50:26 - 200
#5 - 2023-10-30 08:50:26 - 429
#6 - 2023-10-30 08:50:26 - 429
#7 - 2023-10-30 08:50:26 - 429
#8 - 2023-10-30 08:50:26 - 429
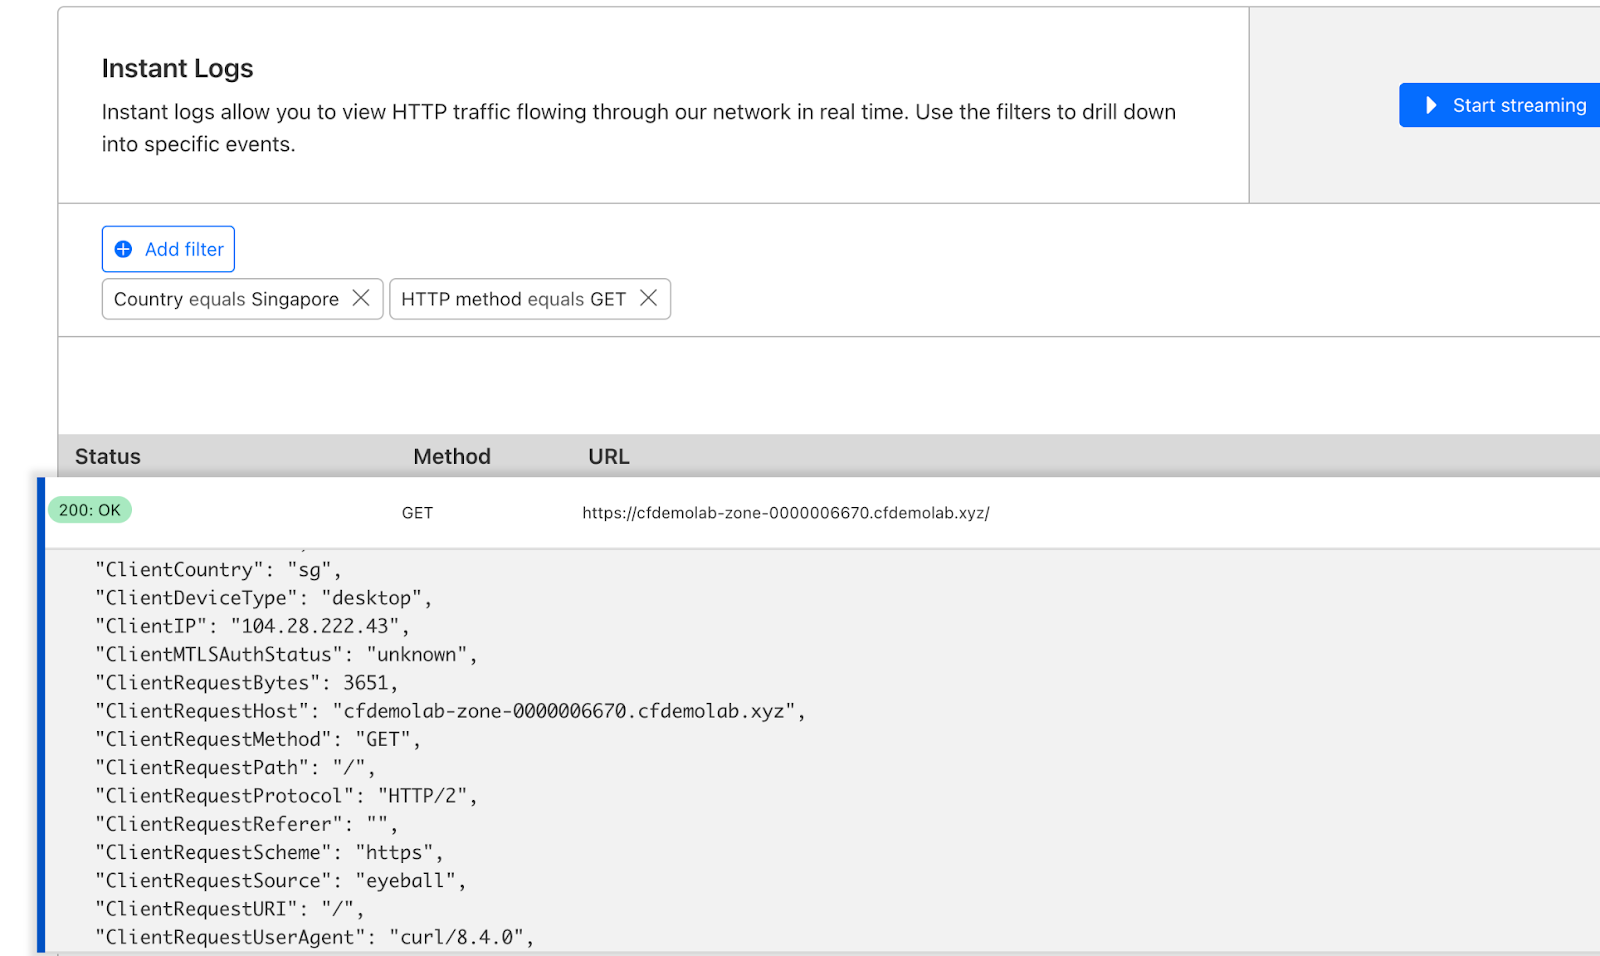
#9 - 2023-10-30 08:50:26 - 429You will see the near real-time traffic matched with the filter (in this example : source country Singapore and HTTP method GET) as depicted below
You can click any of the logs to observed and identify the characteristics of the traffic itself such as User-Agent, Host, Client IP, RayID, DeviceType, etc
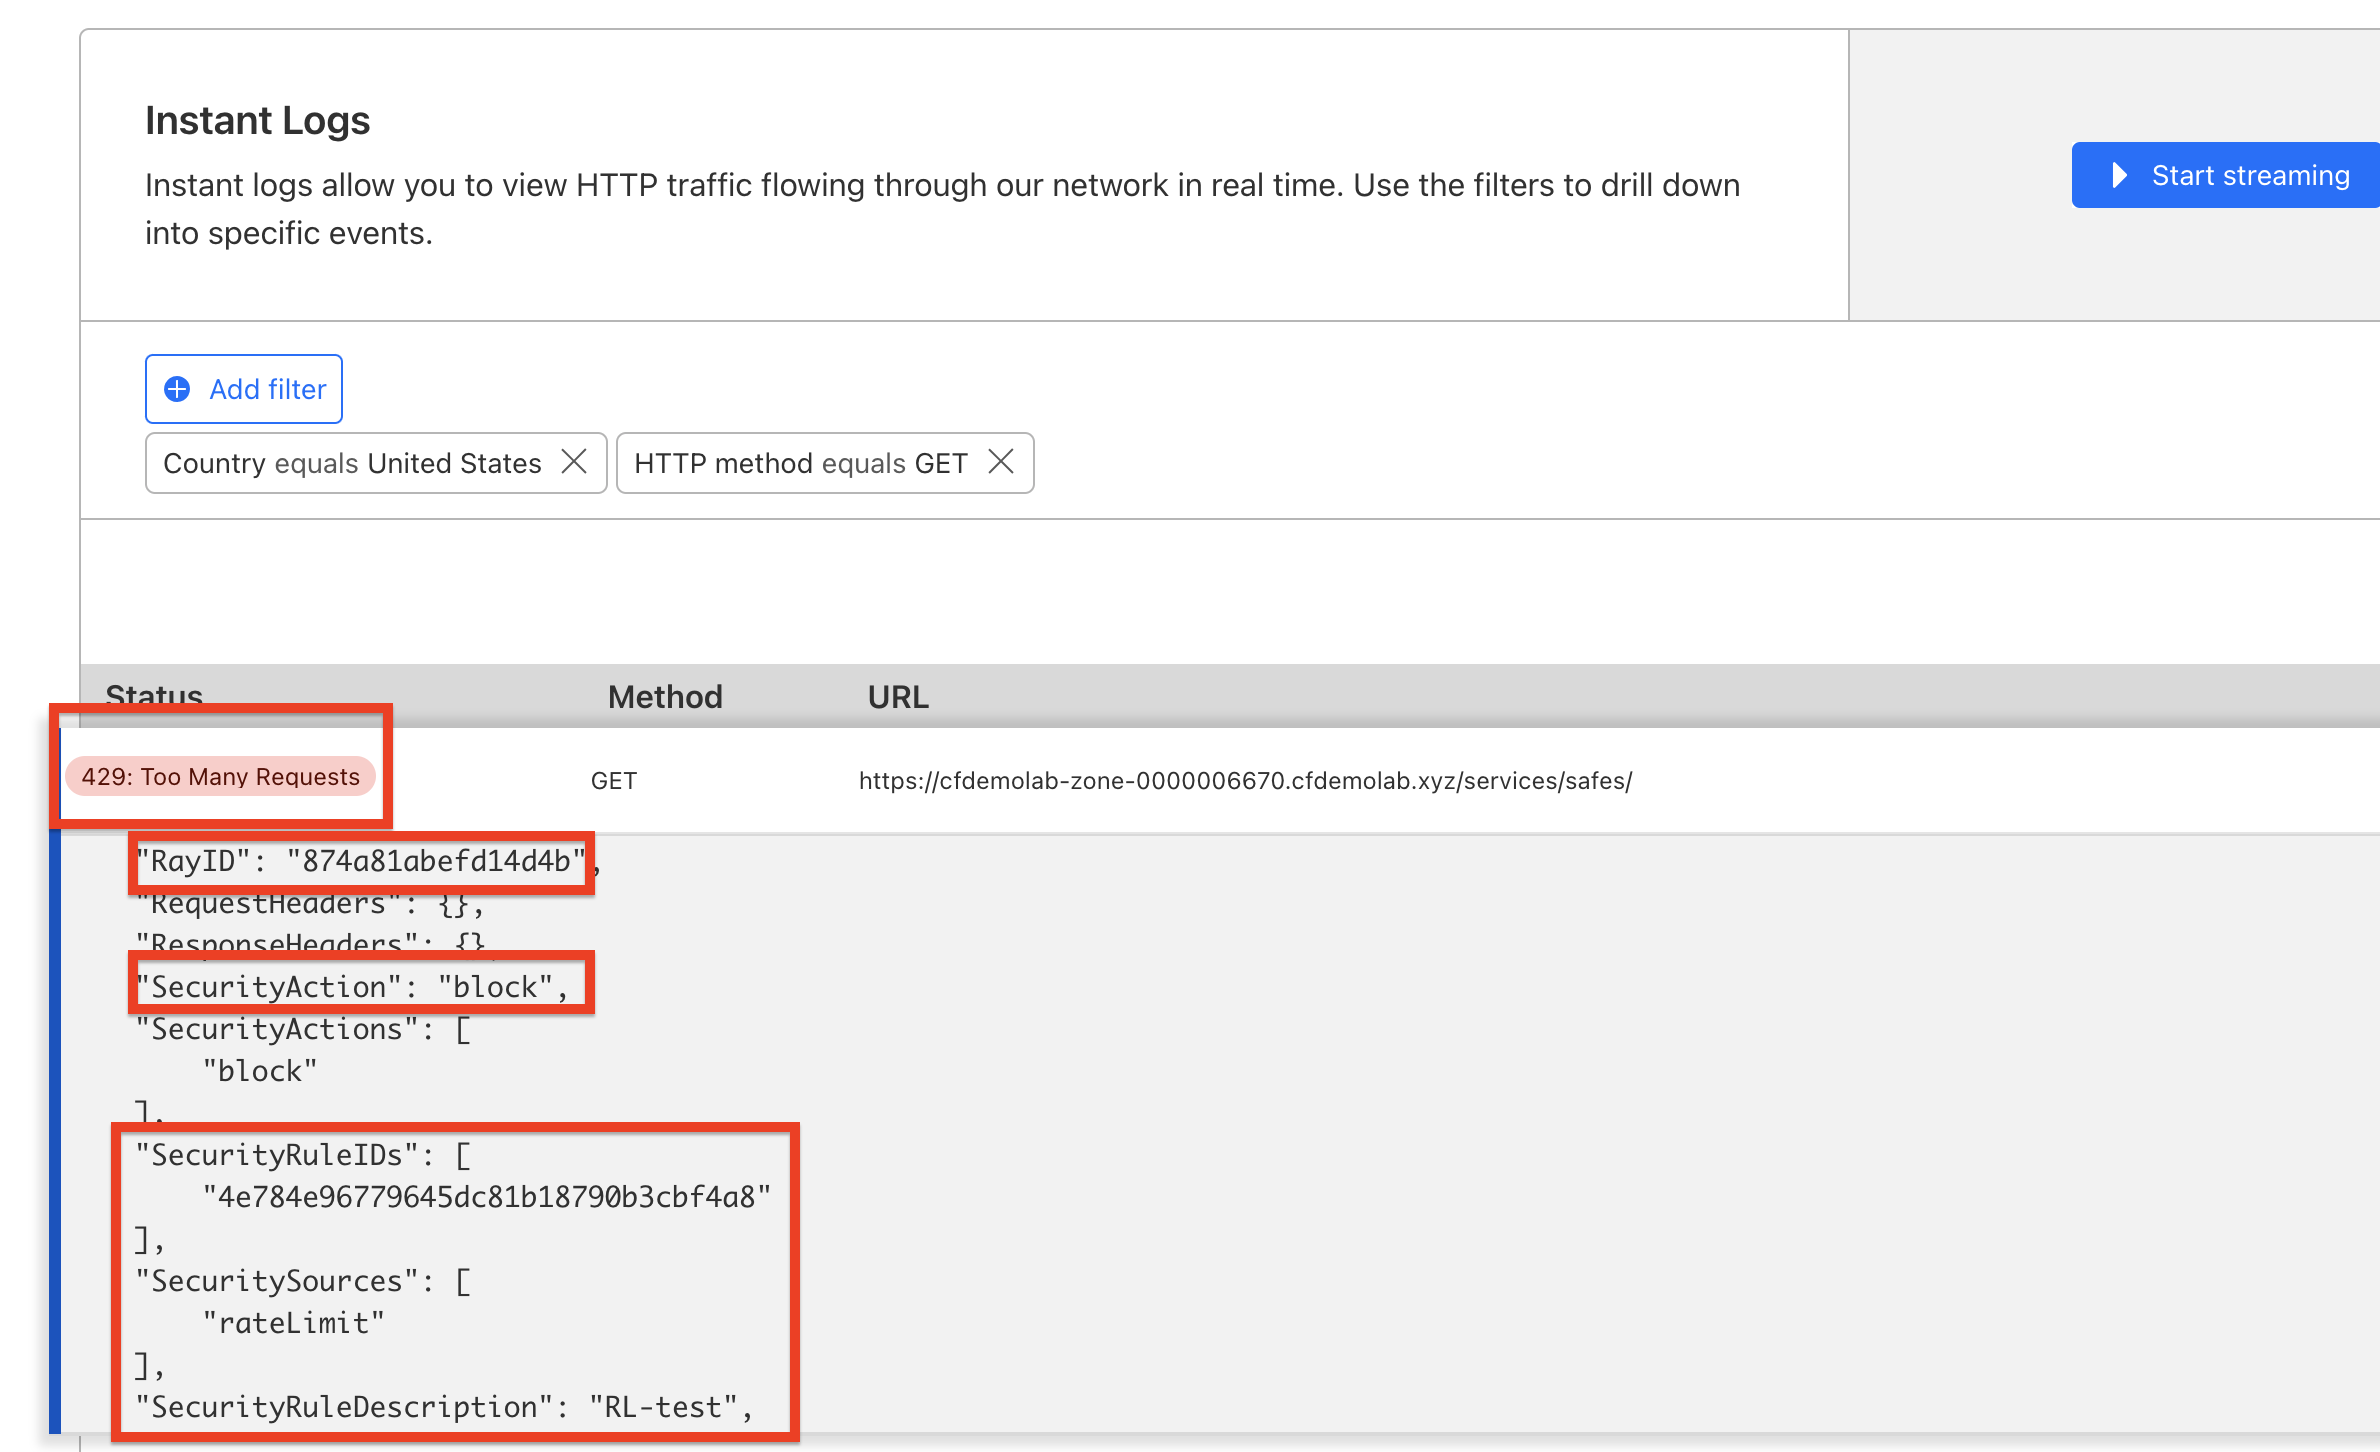
During troubleshooting, you might want to check the other field such as RayID, Security Action, corresponding RuleID that correlated with the HTTP response status (429 for Rate Limit) and Security Sources
Limits
Instant Logs has three limits set in place:
- Only one active Instant Logs session per zone.
- Maximum session time is 60 minutes.
- If you stop listening to a socket for more than five minutes.
If either of these limits are reached, the logs stream will automatically stop.
for the common troubleshooting context, you can check further in https://support.cloudflare.com/hc/en-us/categories/200276217-Troubleshooting
Summary
In this section we’ve explored Cloudflare Trace and Instant Logs.